11. Supported Styles
The following map images have been generated using a custom ArcPy script that uses the Bridge CLI to publish a number of MXD’s. The script uses ArcPy to generate an image for each layer in ArcMap and uses the WMS GetMap request to generate an image for MapServer and GeoServer. The script uses the Bridge managed workspace mode, so for every MXD published Bridge will create a new workspace in GeoServer.
Raster
Continuous Raster
Symbology for continuous raster, one example of a classified symbology and several stretched symbologies.
Layer ‘Classified’
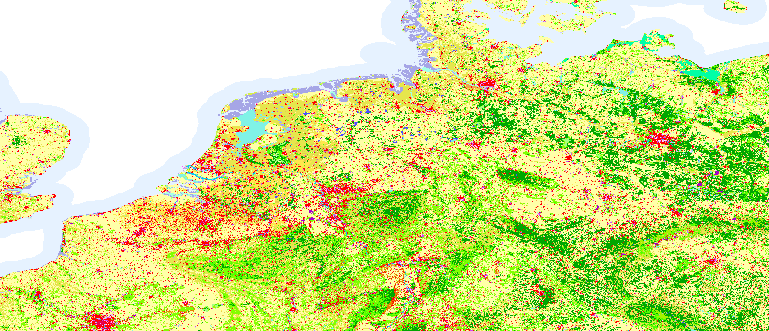
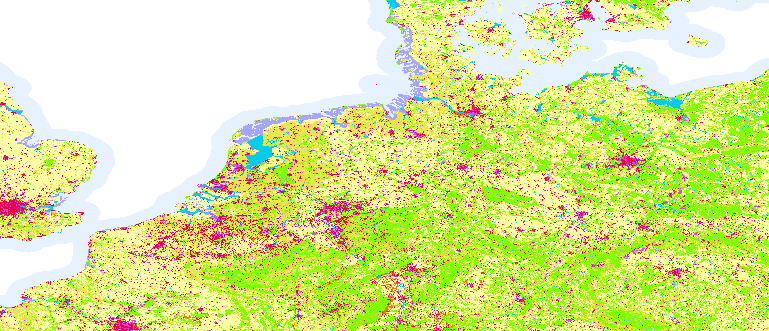
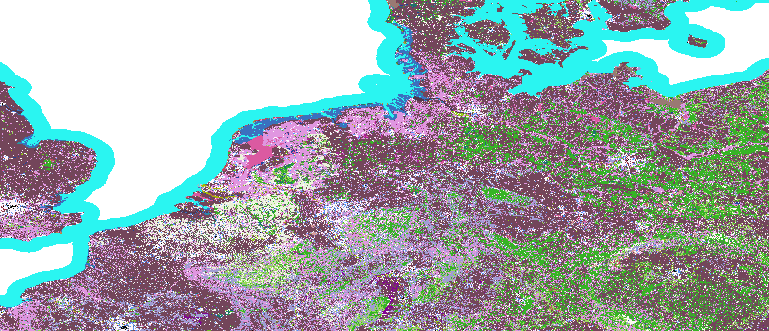
Classified raster symbology.
Layer ‘Classified’ rendered in ArcGIS
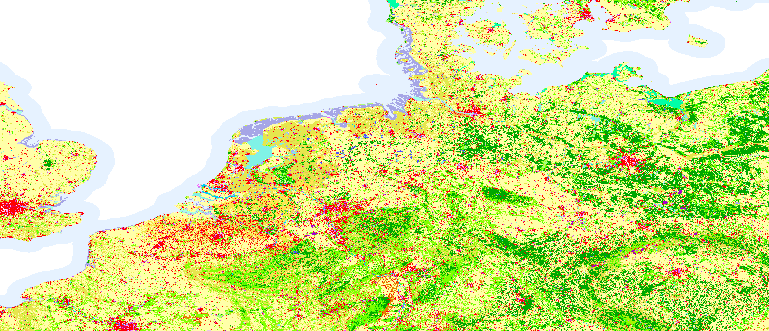
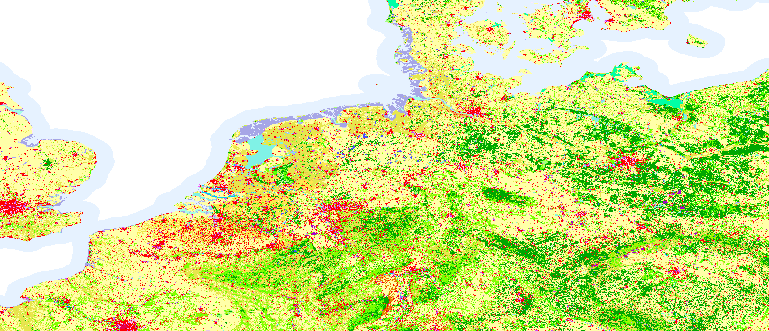
Layer ‘Classified’ rendered in MapServer
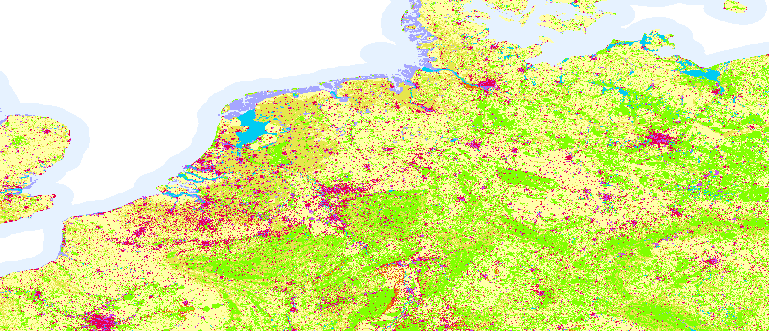
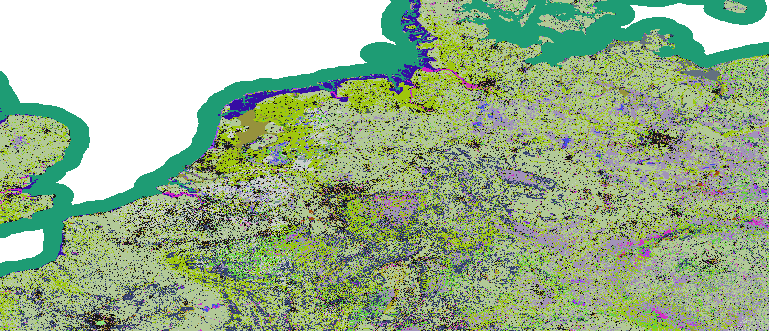
Layer ‘Classified’ rendered in GeoServer
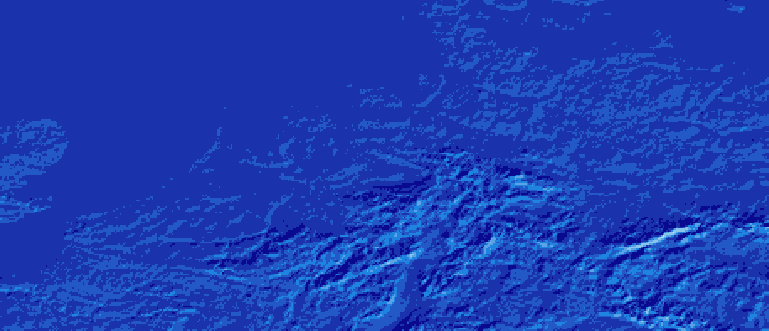
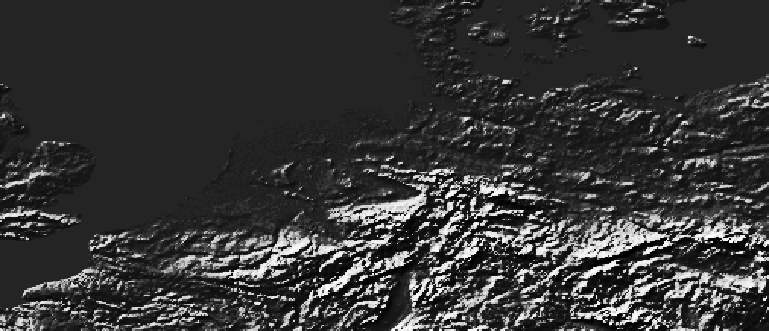
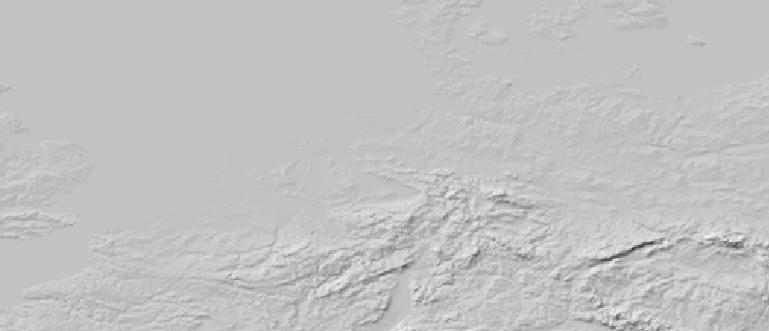
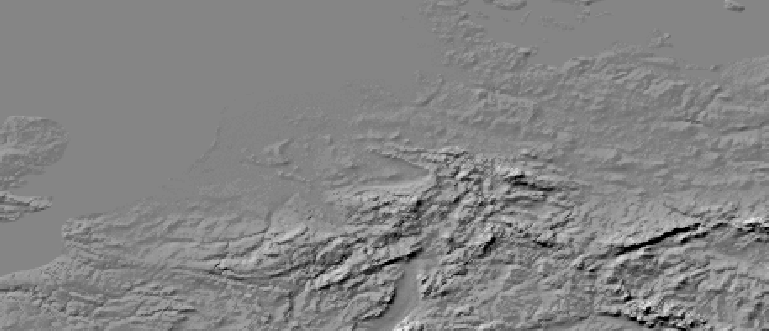
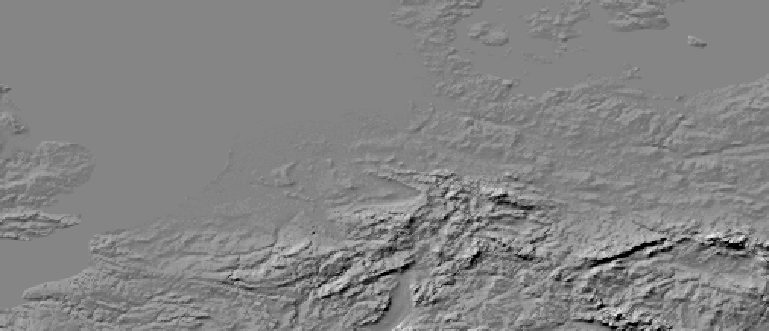
Layer ‘Stretched - histogram equalize’
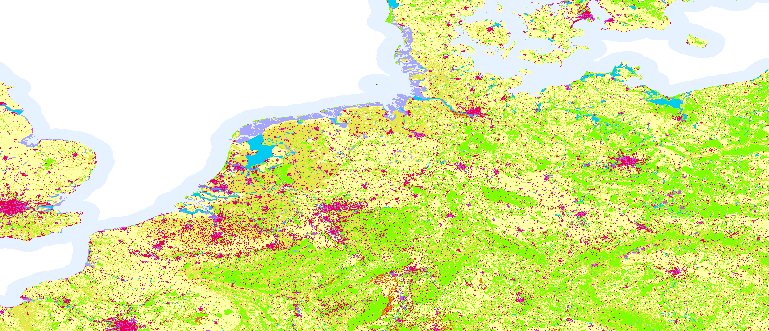
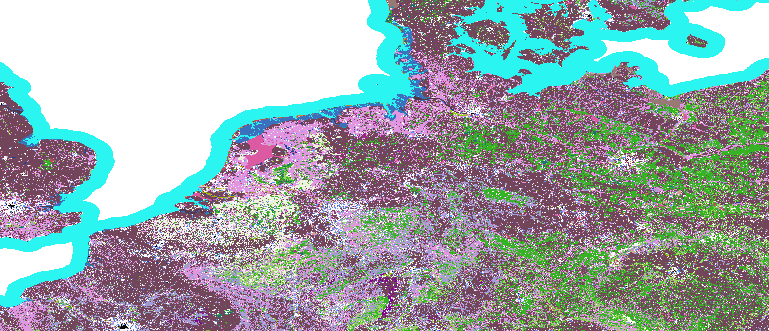
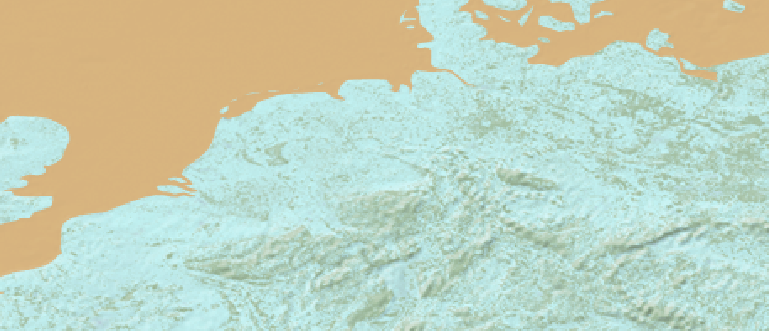
Histogram equalize stretched raster symbology.
Layer ‘Stretched - histogram equalize’ rendered in ArcGIS
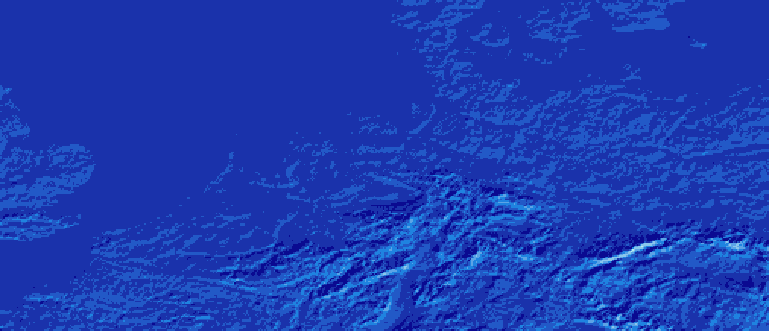
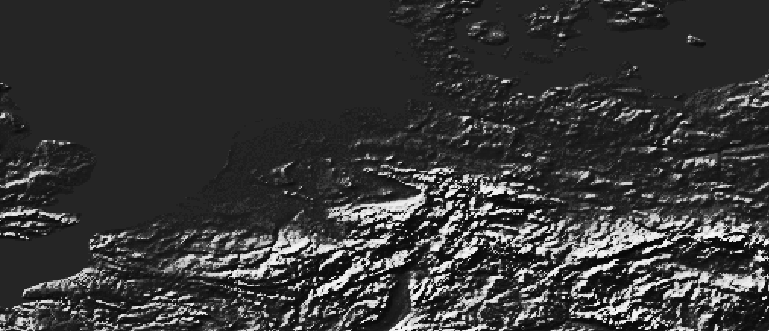
Layer ‘Stretched - histogram equalize’ rendered in MapServer
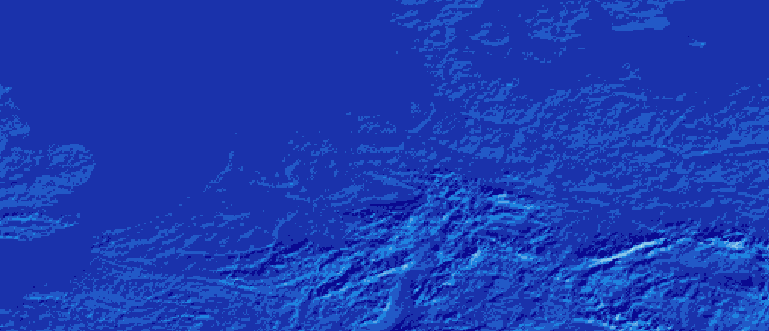
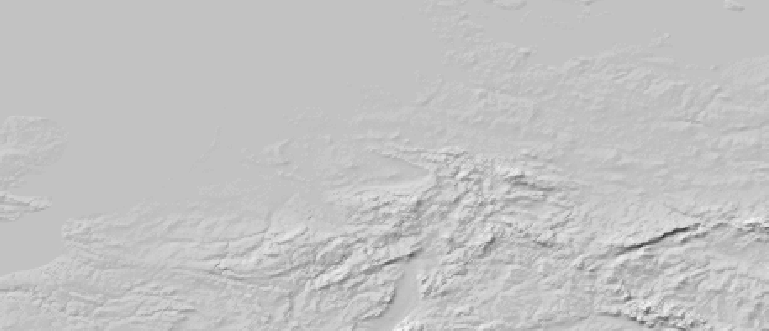
Layer ‘Stretched - histogram equalize’ rendered in GeoServer
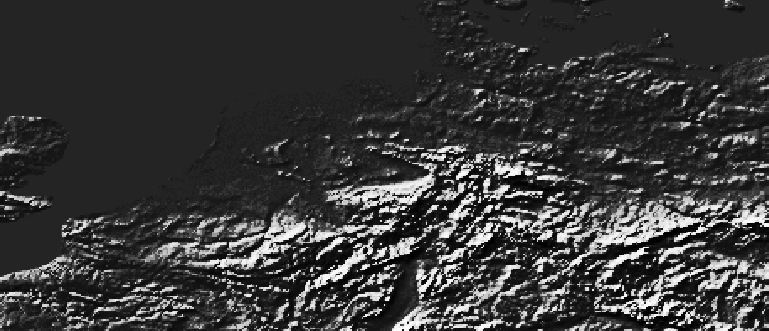
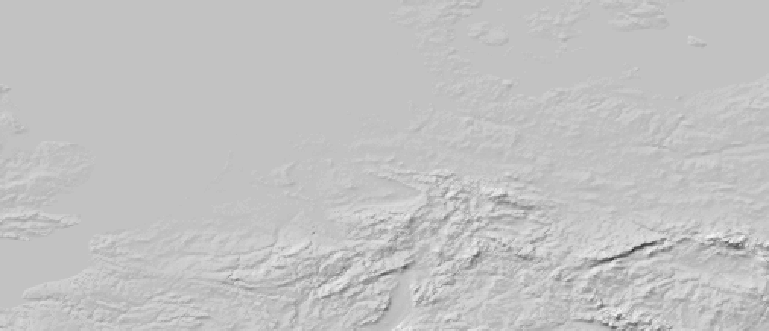
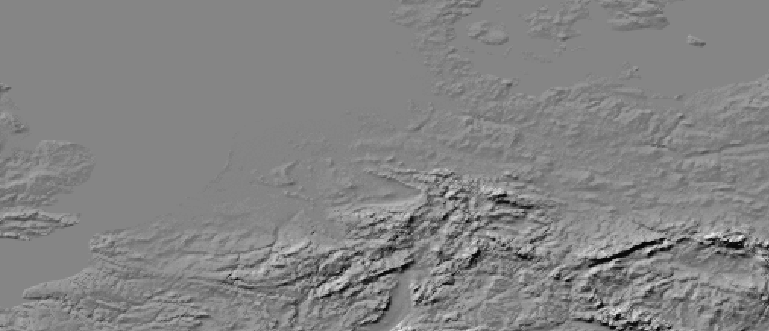
Layer ‘Stretched - min max’
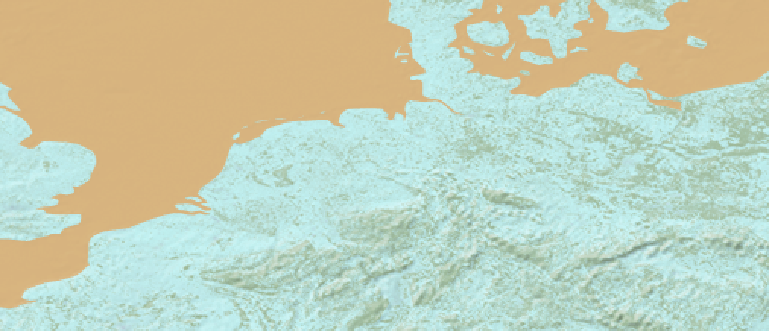
Min-Max stretched raster symbology.
Layer ‘Stretched - min max’ rendered in ArcGIS
Layer ‘Stretched - min max’ rendered in MapServer
Layer ‘Stretched - min max’ rendered in GeoServer
Layer ‘Stretched - standard deviation’
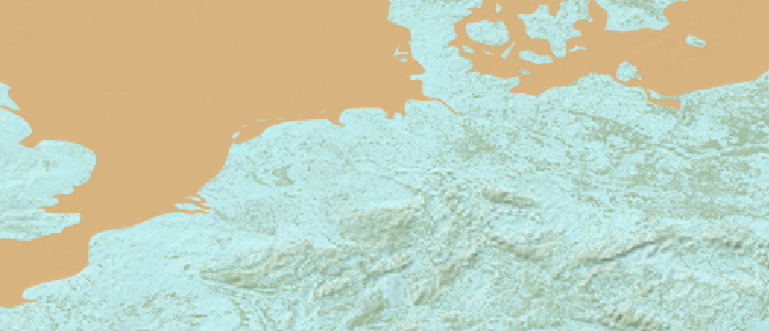
Standard deviation stretched raster symbology.
Layer ‘Stretched - standard deviation’ rendered in ArcGIS
Layer ‘Stretched - standard deviation’ rendered in MapServer
Layer ‘Stretched - standard deviation’ rendered in GeoServer
Discrete Raster
Discrete raster symbologies.
Layer ‘Internal color map’
Symbology using internal color map of GeoTIFF file.
Layer ‘Internal color map’ rendered in ArcGIS

Layer ‘Internal color map’ rendered in MapServer
Layer ‘Internal color map’ rendered in GeoServer
Layer ‘Unique values - grouped values’
Symbology using grouped unique values.
Layer ‘Unique values - grouped values’ rendered in ArcGIS
Layer ‘Unique values - grouped values’ rendered in MapServer
Layer ‘Unique values - grouped values’ rendered in GeoServer
Layer ‘Unique value - attribute table’
Symbology using raster attribute table for classification. Also supports grouping of values.

Layer ‘Unique value - attribute table’ rendered in ArcGIS
Layer ‘Unique value - attribute table’ rendered in MapServer

Layer ‘Unique value - attribute table’ rendered in GeoServer
Layer ‘Discrete color’
Symbology using discrete color.
Layer ‘Discrete color’ rendered in ArcGIS
Layer ‘Discrete color’ rendered in MapServer
Layer ‘Discrete color’ rendered in GeoServer
RGB Raster
Raster with red, green and blue band. Bridge exports the rasters with the band sequence changed to the server. This way it is not required to style the layers at the server.
RGB stretch is not supported by Bridge, because the support for this is limited in GeoServer and MapServer.
The contrast can be enhanced in MapServer by applying the following to the layer element:
PROCESSING "SCALE=AUTO"
The contrast can be enhanced in GeoServer by setting the following in the SLD:
<ChannelSelection>

  <RedChannel>

    <SourceChannelName>1</SourceChannelName>

     <ContrastEnhancement>

        <GammaValue>2</GammaValue>

     </ContrastEnhancement>

  </RedChannel>

  <GreenChannel>

    <SourceChannelName>2</SourceChannelName>

    <ContrastEnhancement>

        <GammaValue>2</GammaValue>

     </ContrastEnhancement>

  </GreenChannel>

  <BlueChannel>

    <SourceChannelName>3</SourceChannelName>

    <ContrastEnhancement>

        <GammaValue>2</GammaValue>

     </ContrastEnhancement>

  </BlueChannel>

</ChannelSelection>
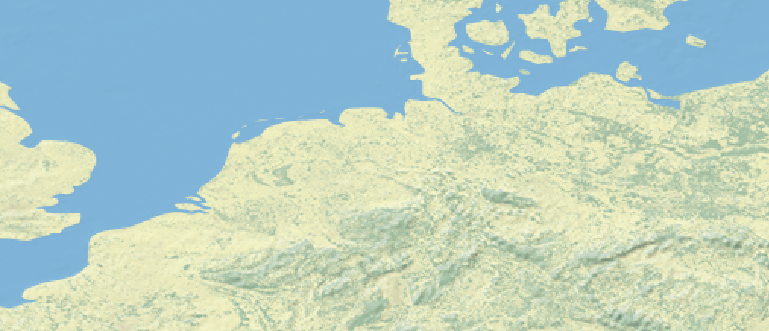
Layer ‘Natural earth - bgr’
False colour palette; red, blue, green:green, red, blue.
Layer ‘Natural earth - bgr’ rendered in ArcGIS
Layer ‘Natural earth - bgr’ rendered in MapServer
Layer ‘Natural earth - bgr’ rendered in GeoServer
Layer ‘Natural earth - rgb’
True color palette.
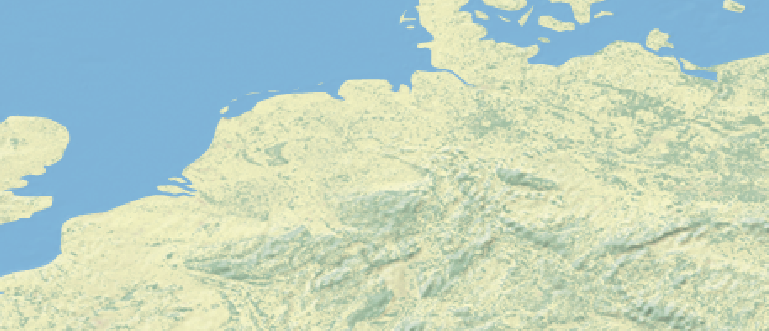
Layer ‘Natural earth - rgb’ rendered in ArcGIS

Layer ‘Natural earth - rgb’ rendered in MapServer
Layer ‘Natural earth - rgb’ rendered in GeoServer
Vector
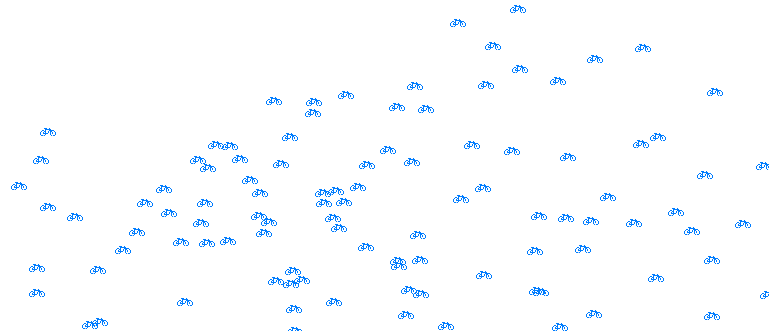
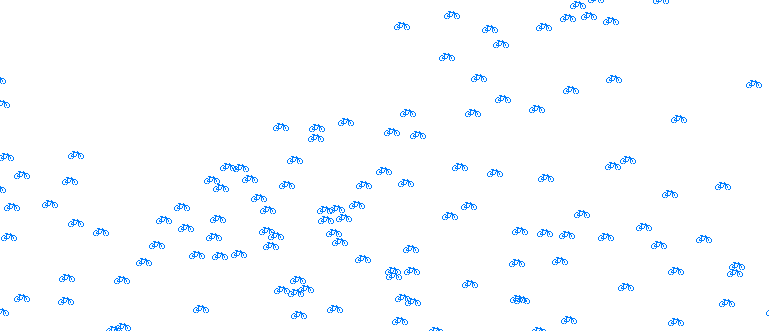
Character Symbol
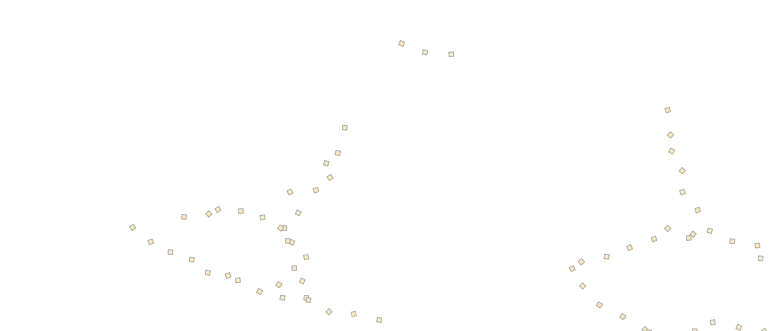
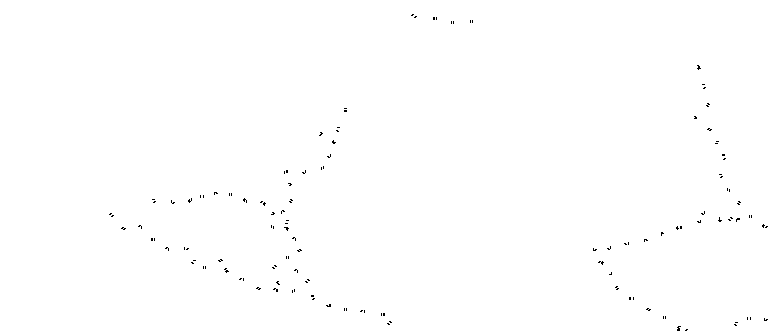
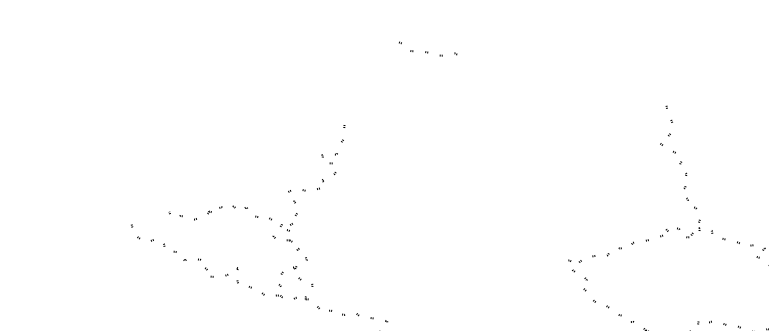
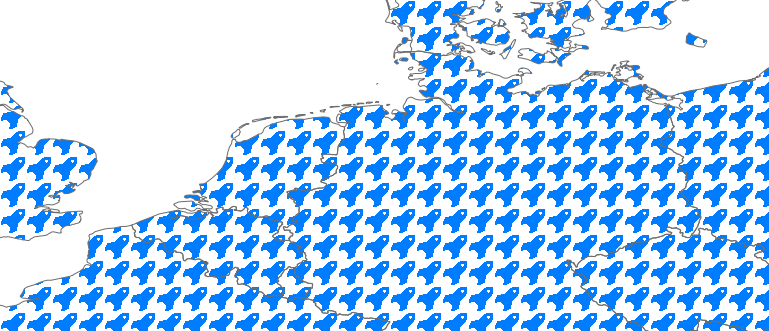
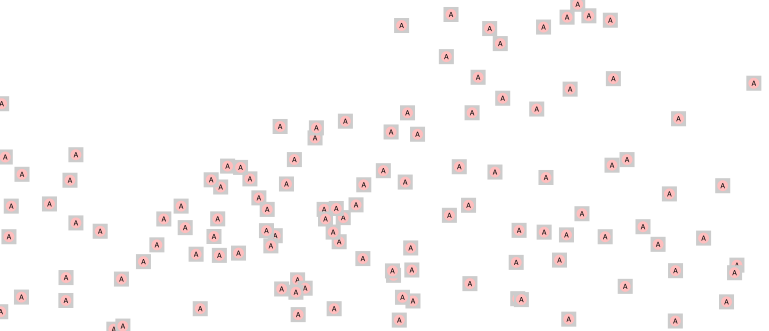
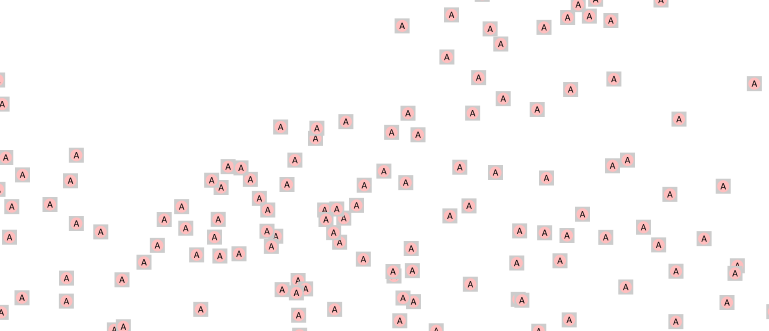
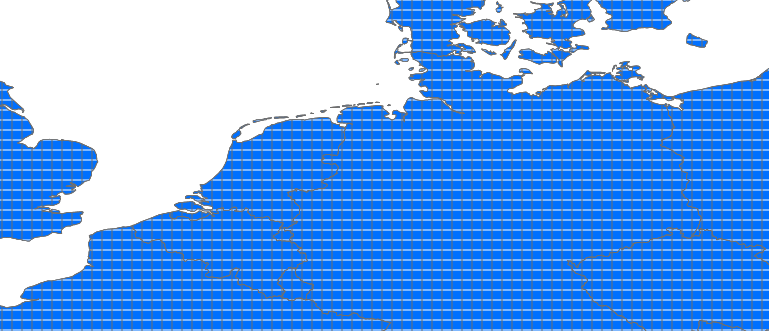
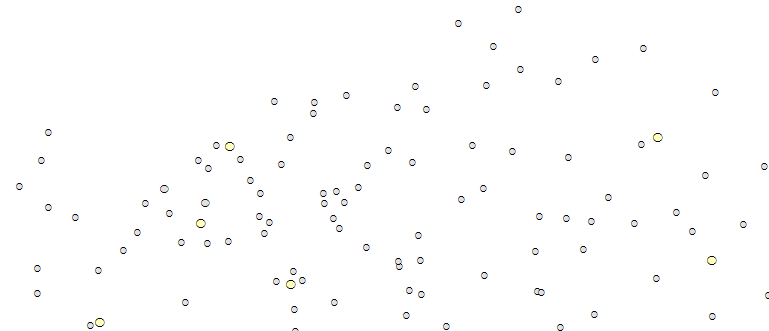
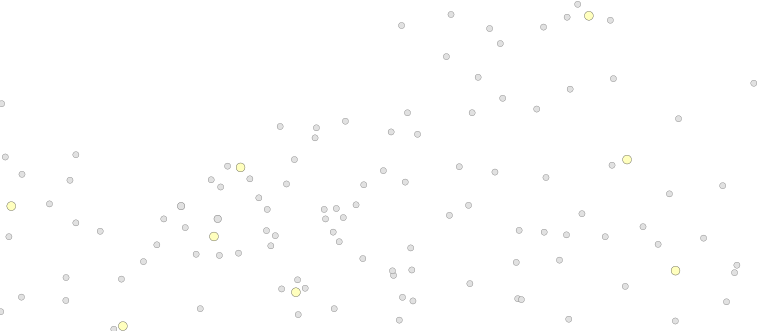
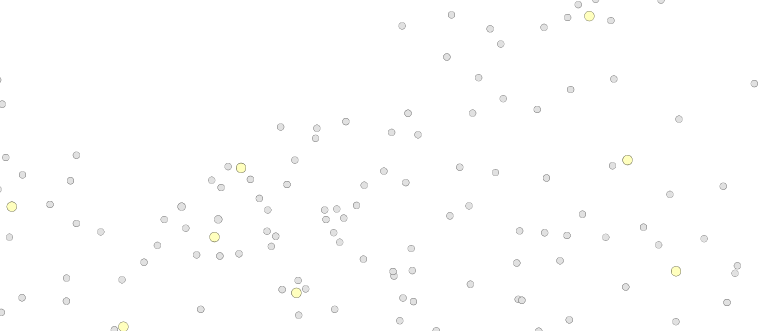
Character symbol used for point in layer Cities marker line symbol with character symbol used for Rivers and a marker fill symbol with character symbol used for Countries.
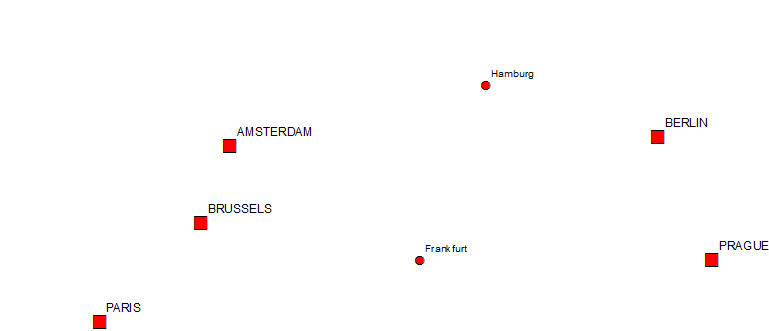
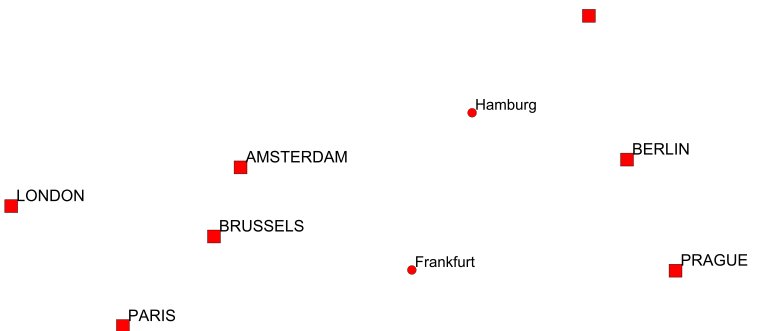
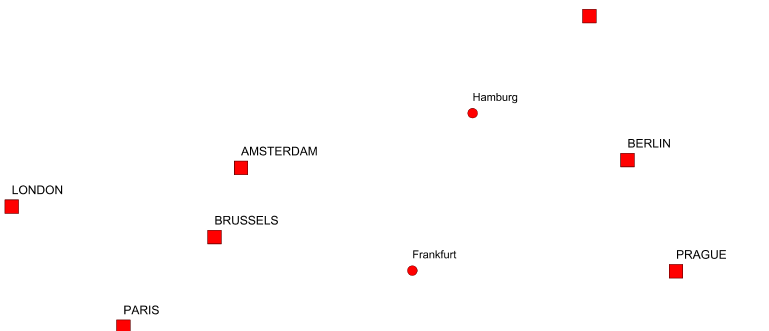
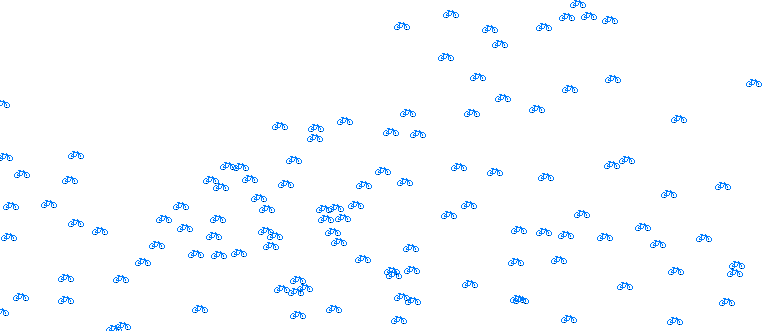
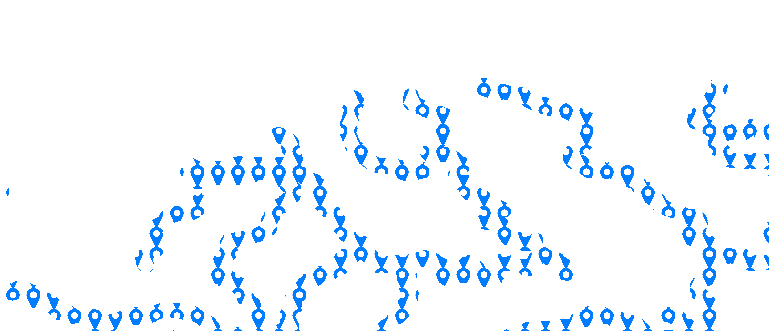
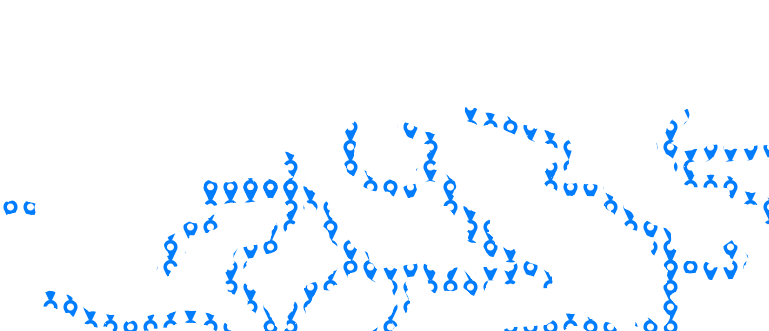
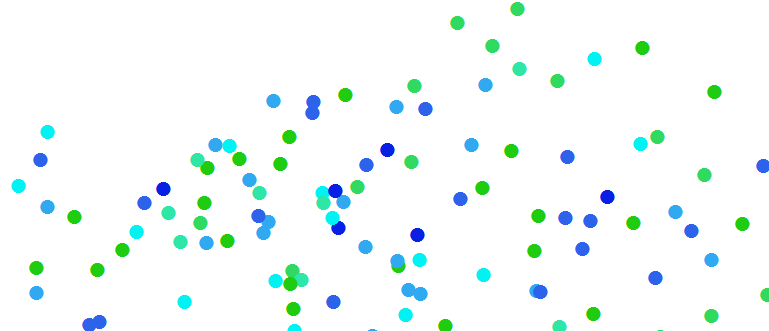
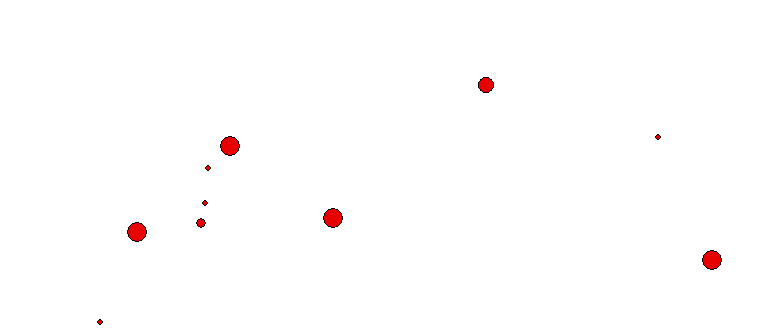
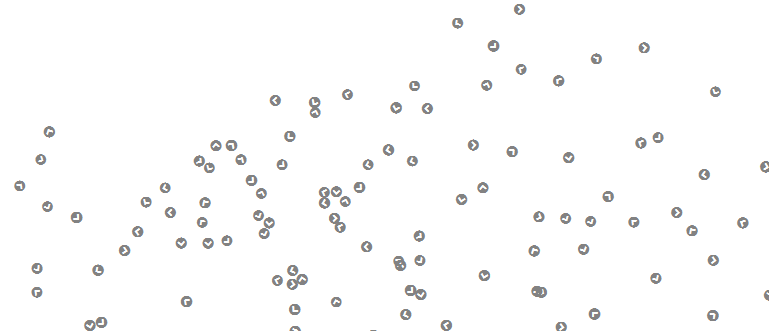
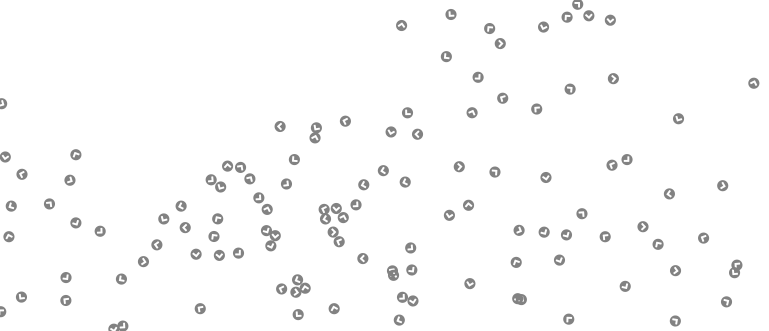
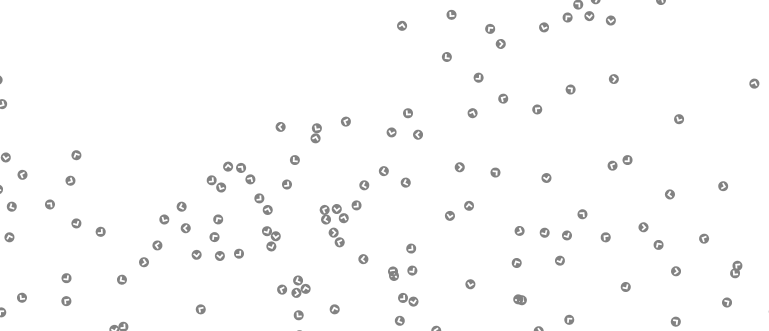
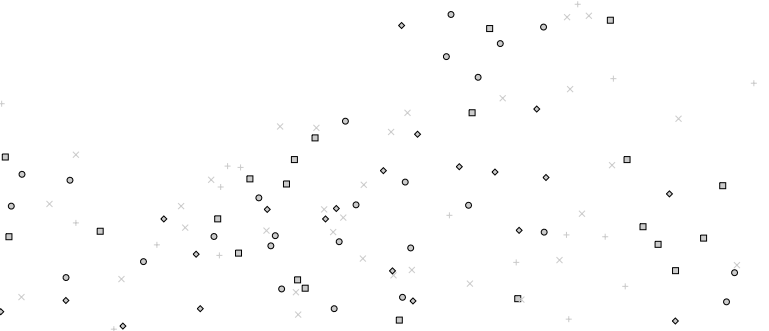
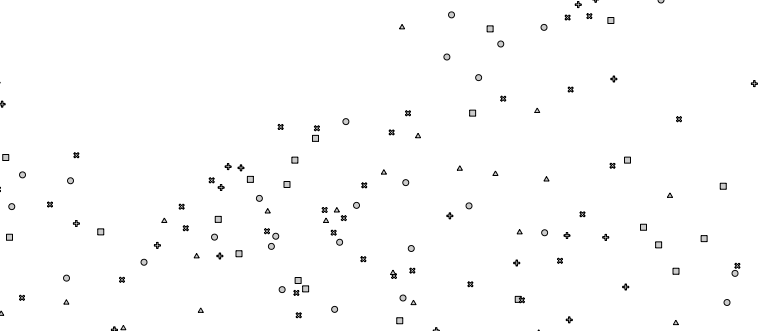
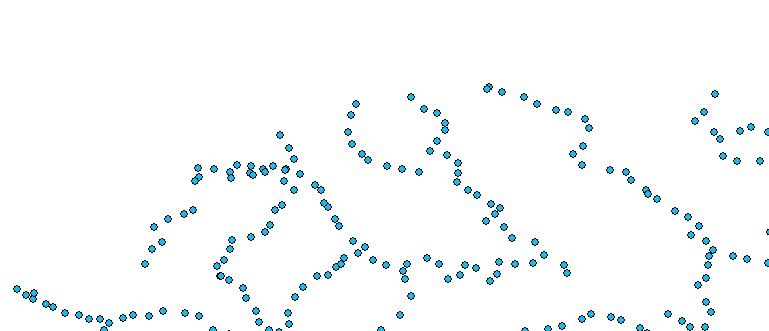
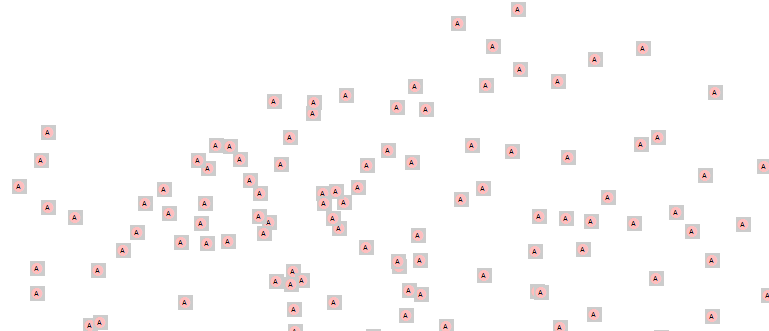
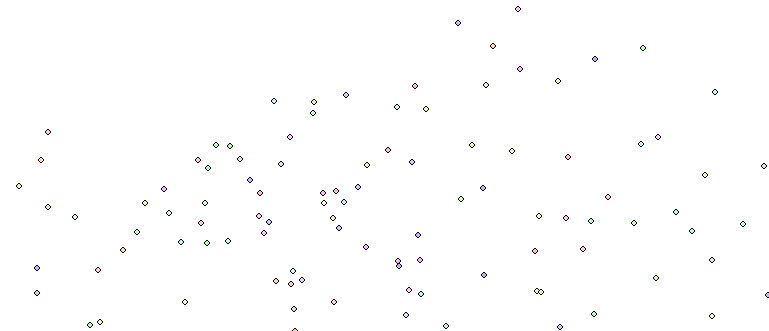
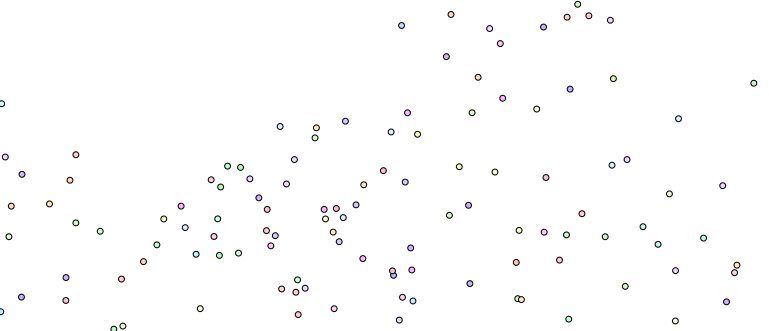
Layer ‘Cities’
Point layer with a character marker symbol.
Layer ‘Cities’ rendered in ArcGIS

Layer ‘Cities’ rendered in MapServer

Layer ‘Cities’ rendered in GeoServer
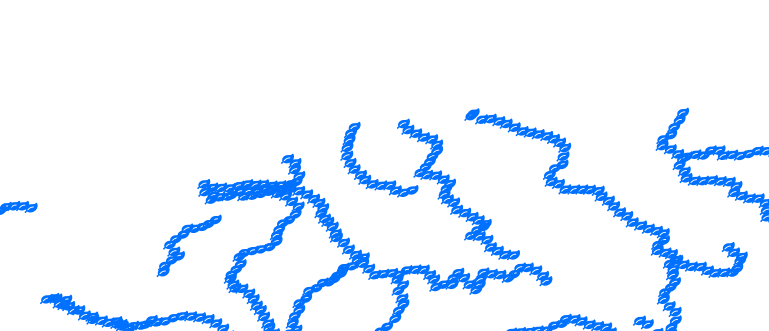
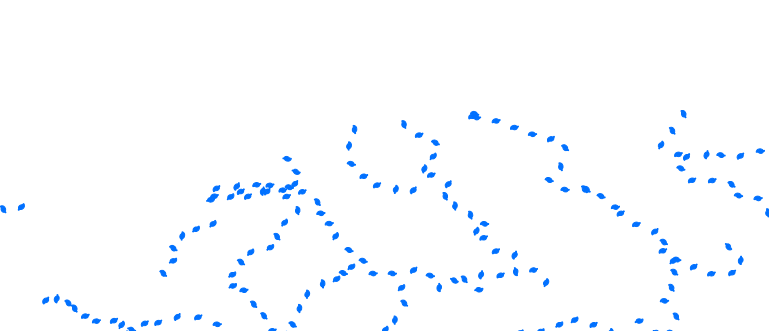
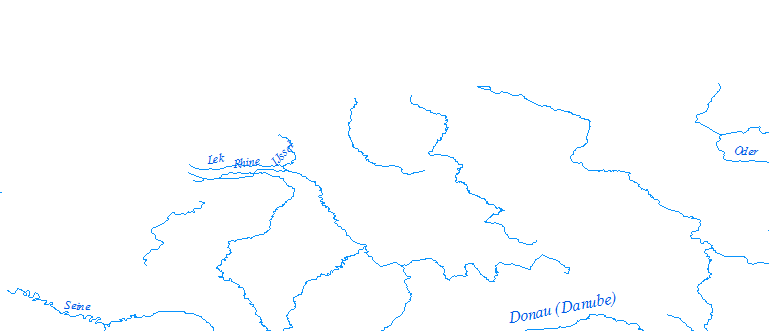
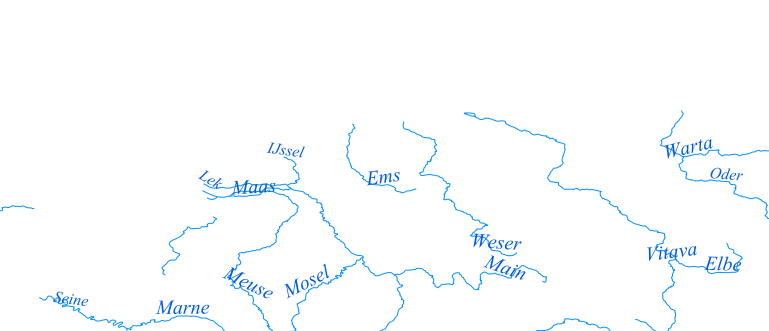
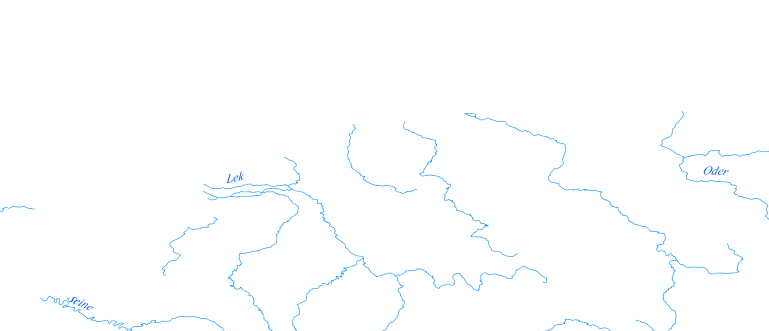
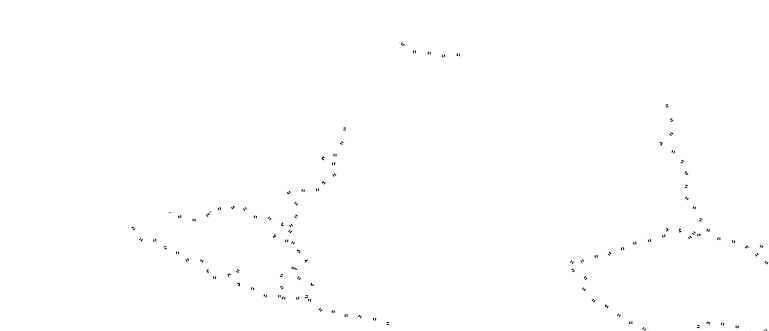
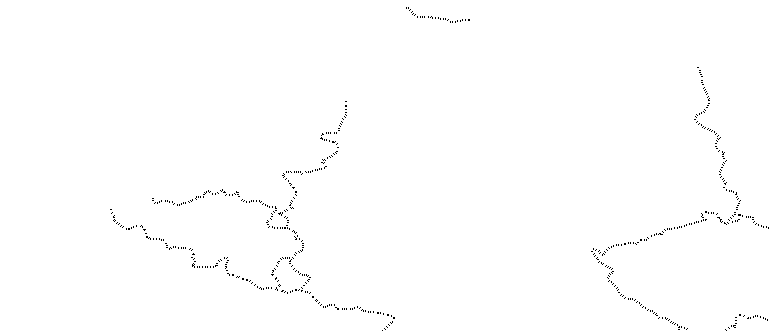
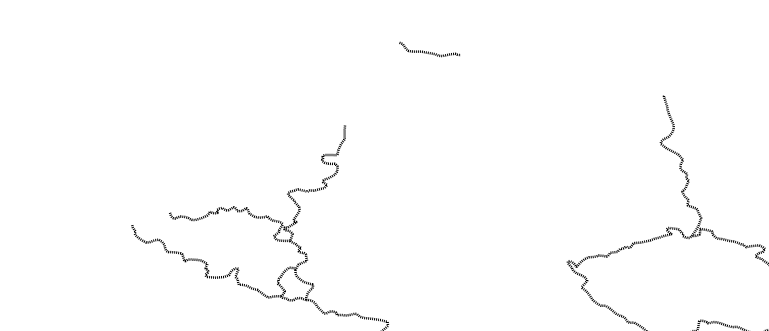
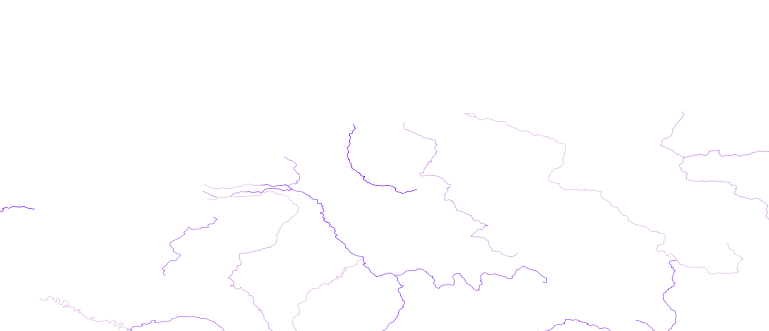
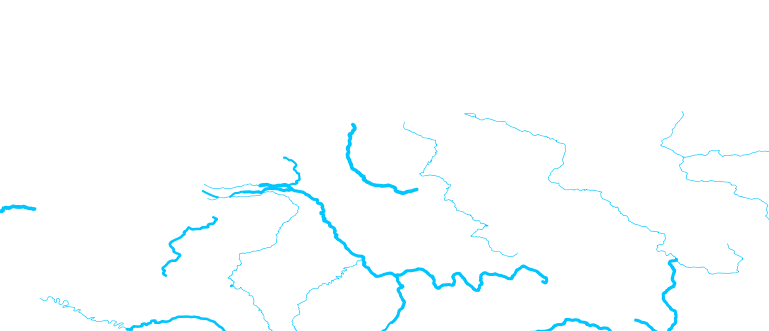
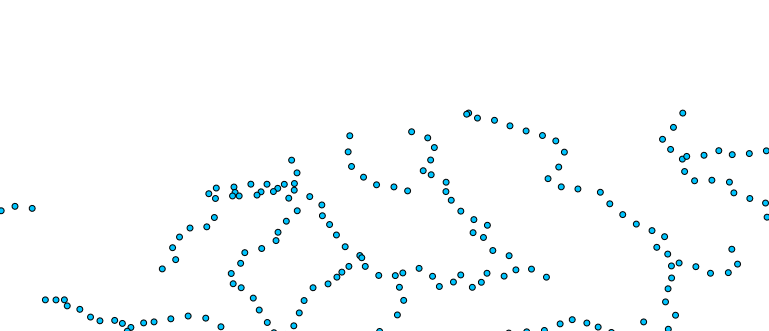
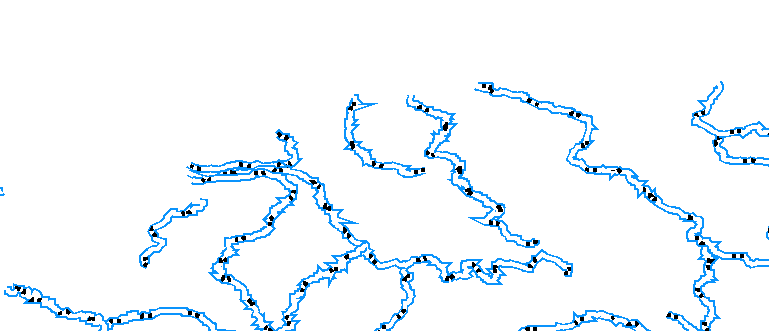
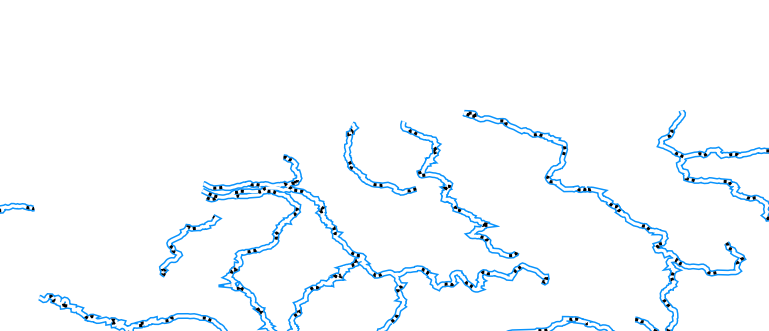
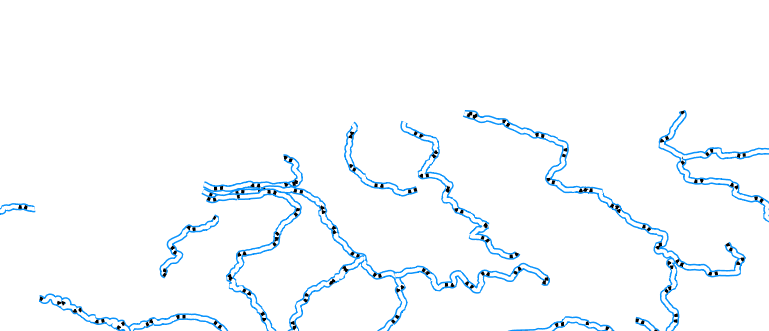
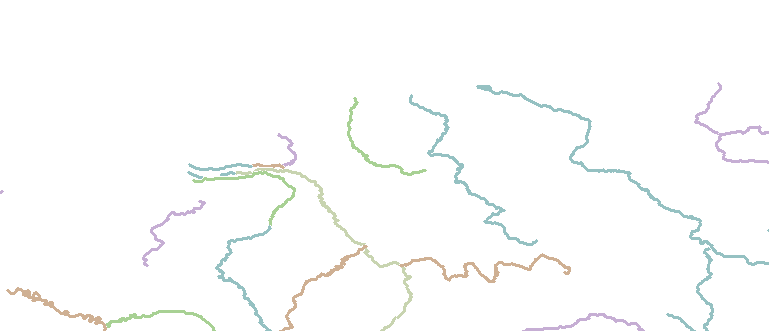
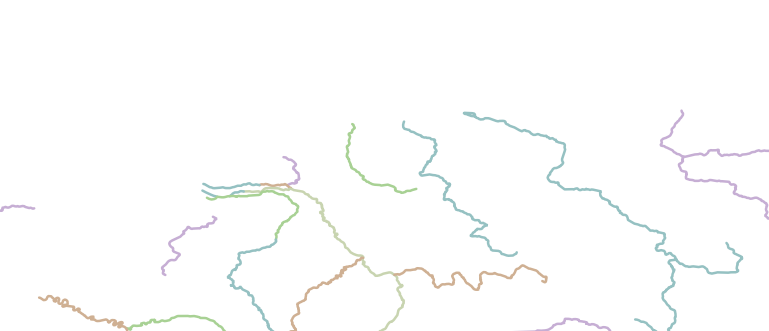
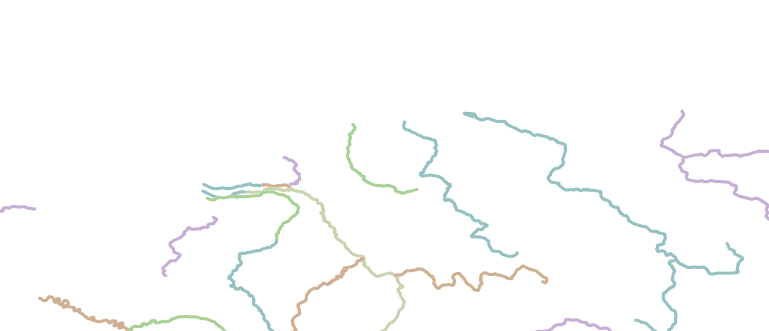
Layer ‘Rivers’
Line layer with a character marker line symbol.
Layer ‘Rivers’ rendered in ArcGIS
Layer ‘Rivers’ rendered in MapServer
Layer ‘Rivers’ rendered in GeoServer
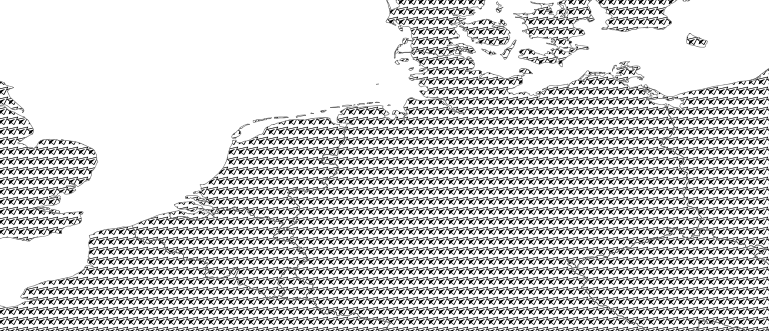
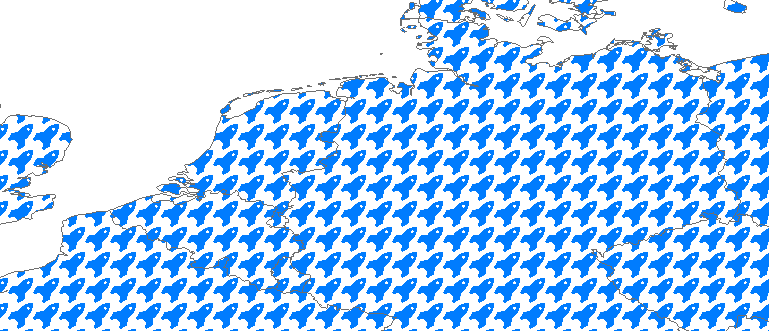
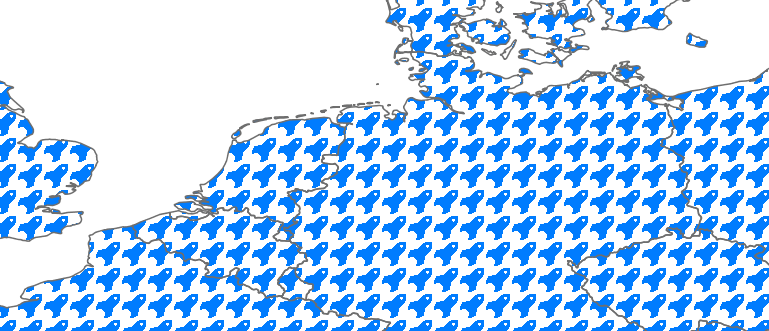
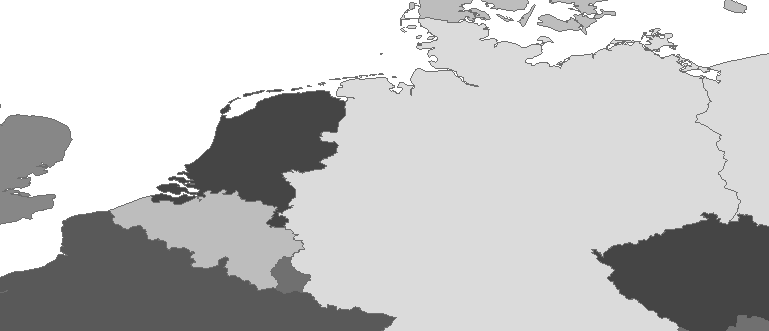
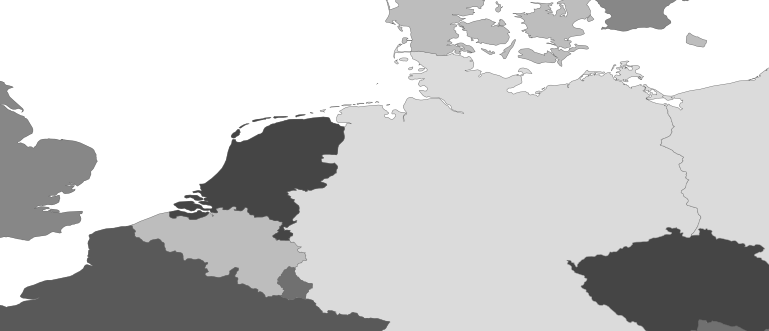
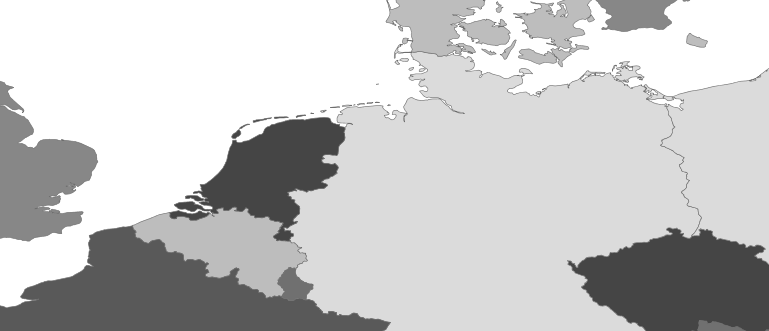
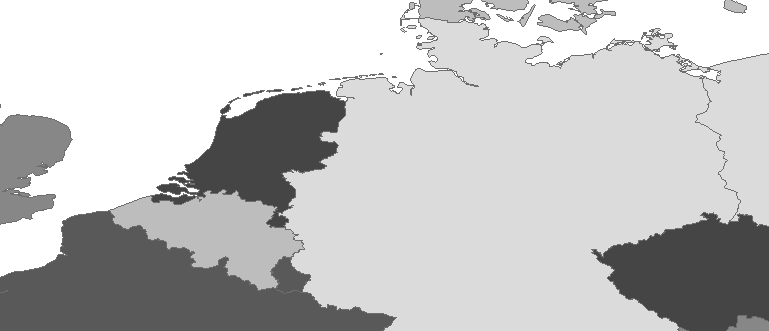
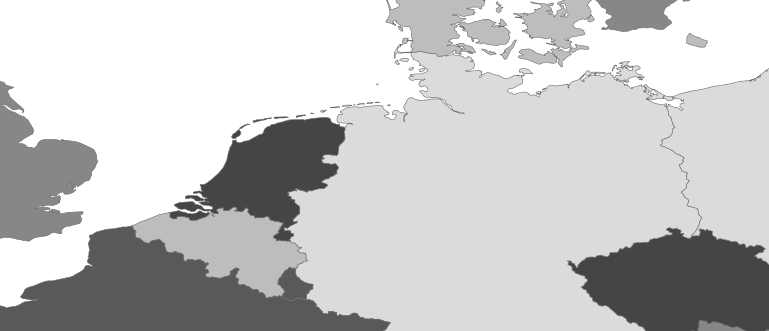
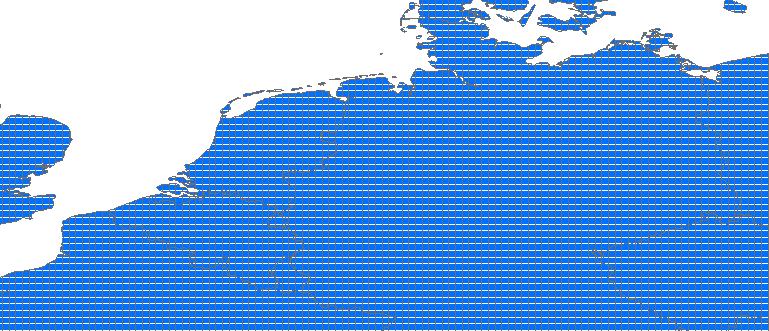
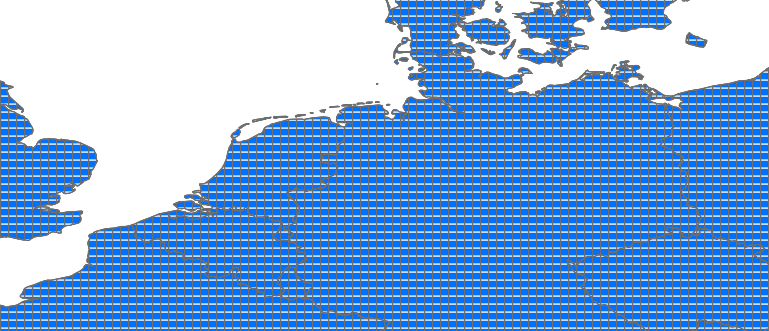
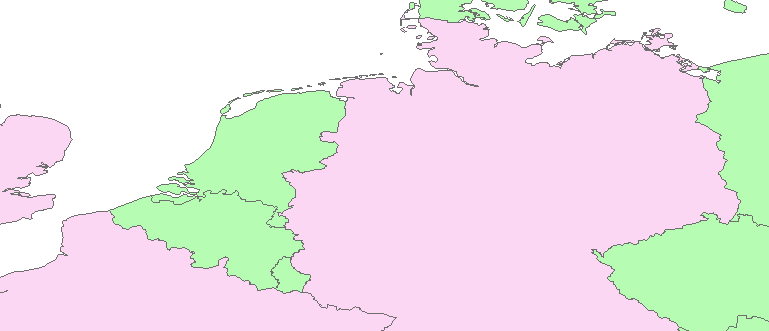
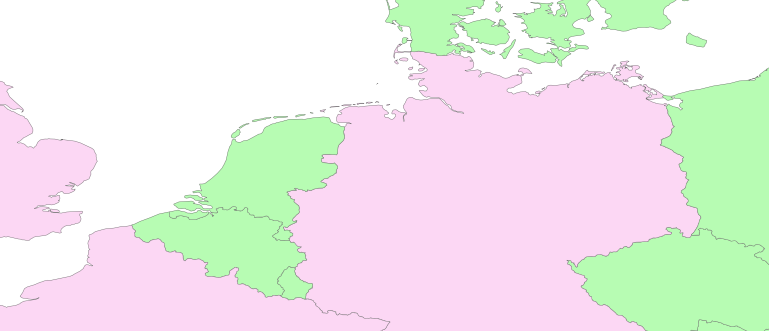
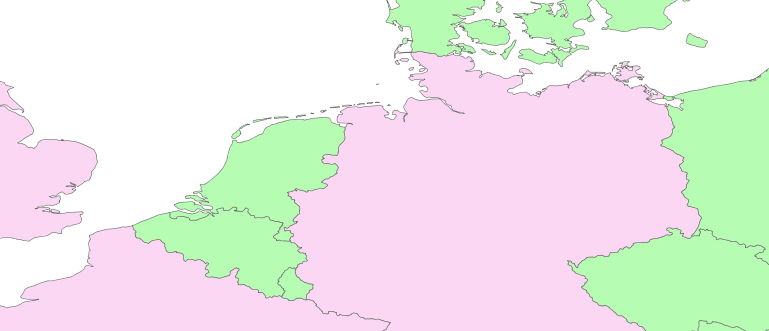
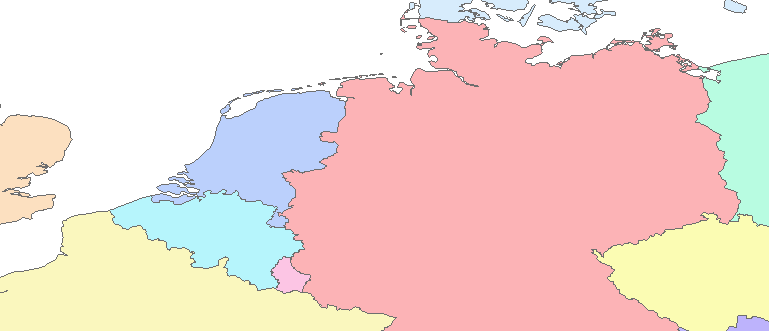
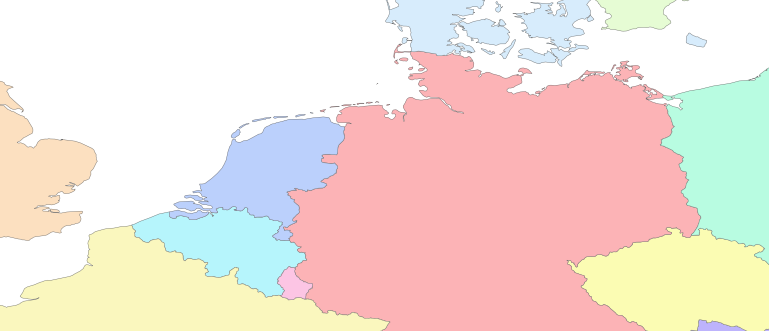
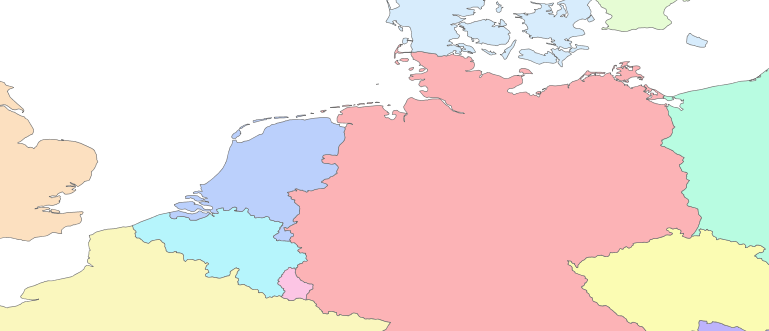
Layer ‘Countries’
Polygon layer with a character marker fill symbol.
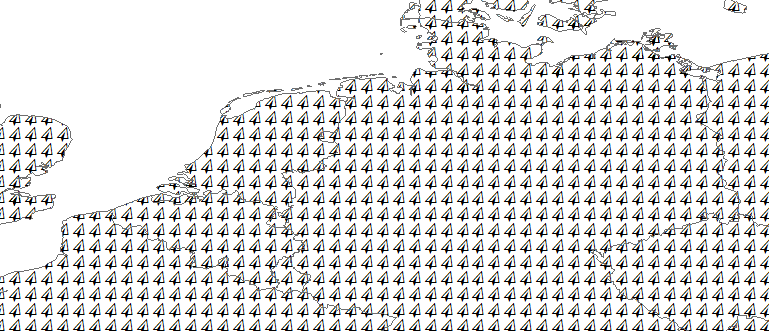
Layer ‘Countries’ rendered in ArcGIS

Layer ‘Countries’ rendered in MapServer
Layer ‘Countries’ rendered in GeoServer
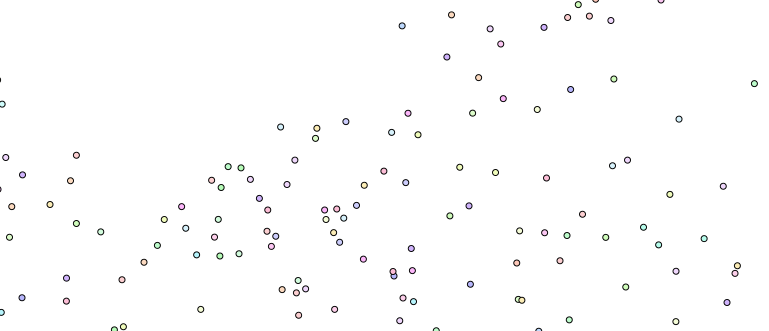
Label Symbol
Label symbology.Layer Cities uses a multivariate classification for symbols and labels. Layer Rivers uses a classification for the labels and layer Countries are all labelled the same way, in upper case.
Layer ‘Cities’
Multivariate classification, on both SCALERANK and ADM0CAP attribute. Labels are using the same classification.
Layer ‘Cities’ rendered in ArcGIS
Layer ‘Cities’ rendered in MapServer
Layer ‘Cities’ rendered in GeoServer
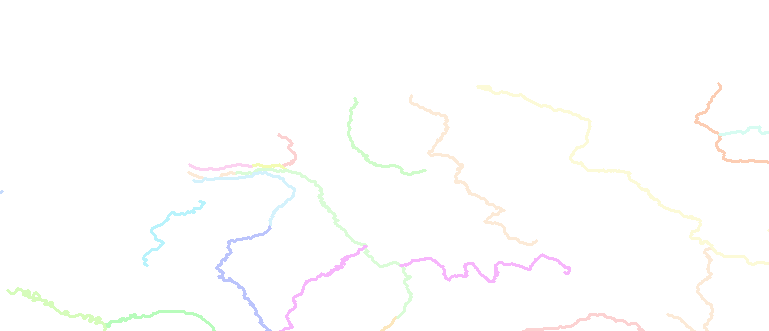
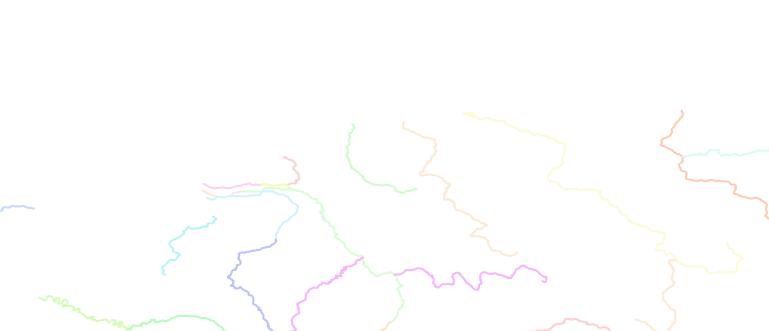
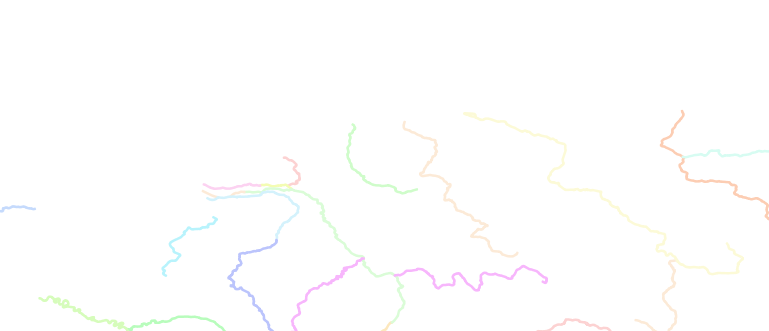
Layer ‘Rivers’
Single symbol with classifed labels, when specifying label classes it is required for MapServer to create a class that is not labelled, otherwise the features without labels are not showing up in MapServer.
Layer ‘Rivers’ rendered in ArcGIS
Layer ‘Rivers’ rendered in MapServer
Layer ‘Rivers’ rendered in GeoServer
Layer ‘Countries’
Features all labelled the same way, labels in uppercase.
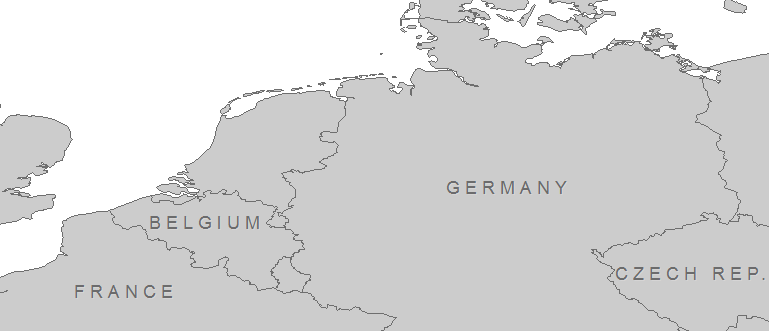
Layer ‘Countries’ rendered in ArcGIS
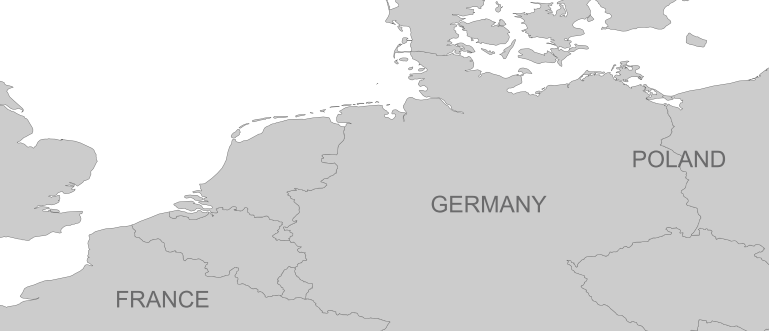
Layer ‘Countries’ rendered in MapServer

Layer ‘Countries’ rendered in GeoServer
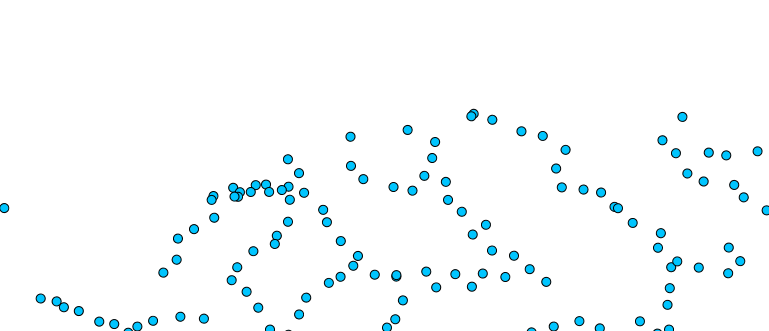
Line Fill Symbol
Line fill symbol, also known as “hatch fill”.
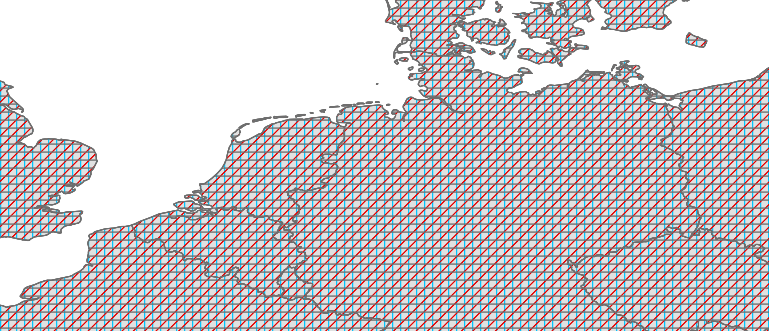
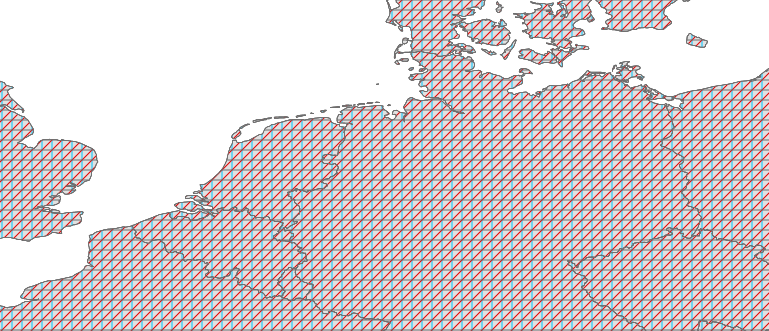
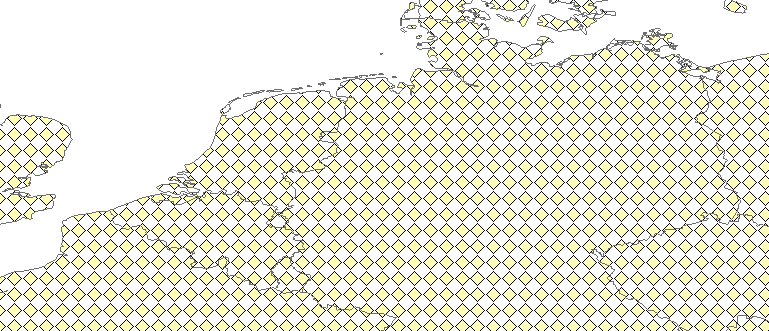
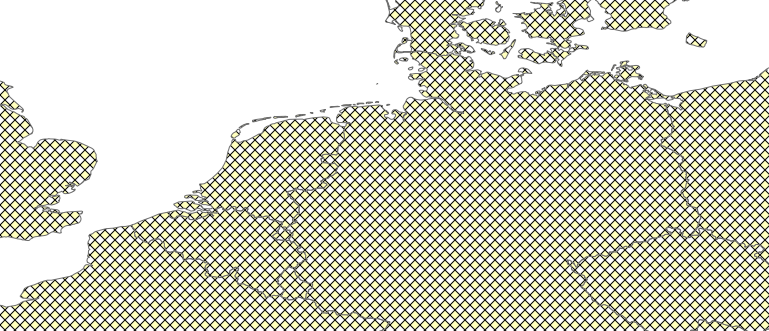
Layer ‘Arbitrary angle line fill’
Hatch fill symbol with lines under an angle of 10 degrees.
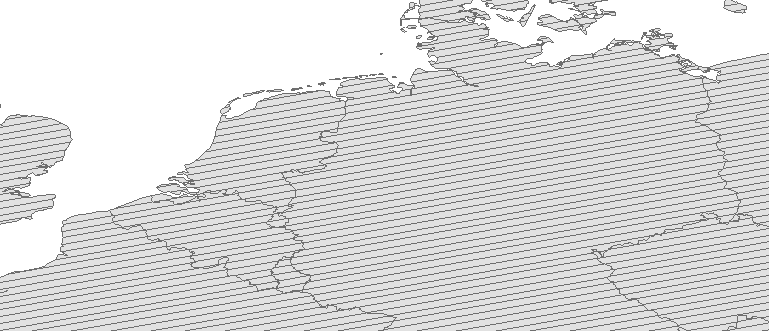
Layer ‘Arbitrary angle line fill’ rendered in ArcGIS

Layer ‘Arbitrary angle line fill’ rendered in MapServer
Layer ‘Arbitrary angle line fill’ rendered in GeoServer
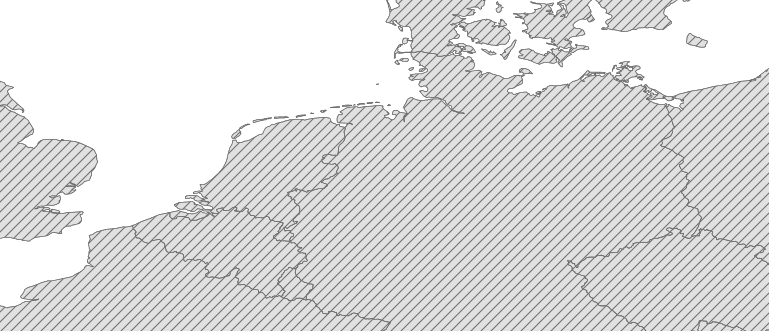
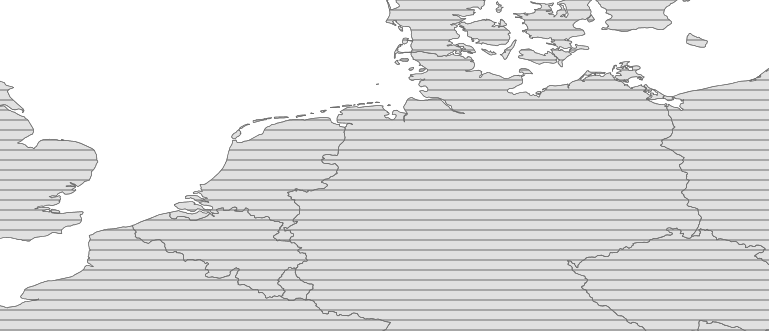
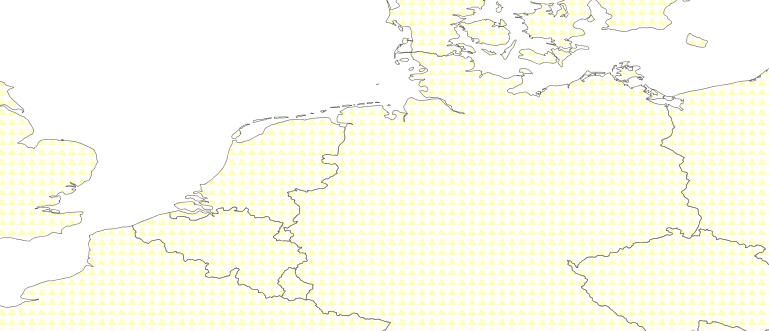
Layer ‘Single line fill’
Hatch fill symbol with single line fill.

Layer ‘Single line fill’ rendered in ArcGIS

Layer ‘Single line fill’ rendered in MapServer
Layer ‘Single line fill’ rendered in GeoServer
Layer ‘Overlapping line fill’
Hatch fill symbol with overlapping line fills.
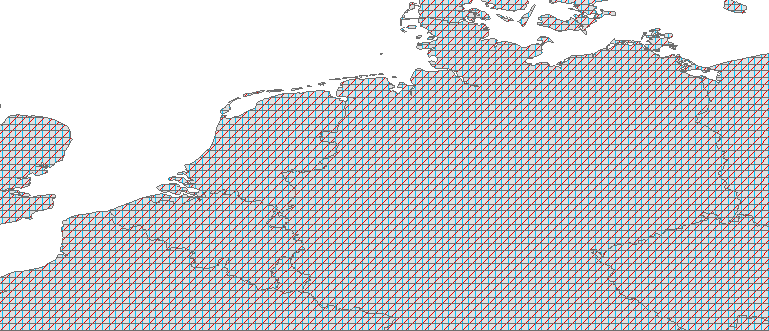
Layer ‘Overlapping line fill’ rendered in ArcGIS
Layer ‘Overlapping line fill’ rendered in MapServer
Layer ‘Overlapping line fill’ rendered in GeoServer
Line Symbols
Symbology with line symbols on polyline layers.
Layer ‘Marker line’
Symbology with marker line symbol.
Layer ‘Marker line’ rendered in ArcGIS
Layer ‘Marker line’ rendered in MapServer
Layer ‘Marker line’ rendered in GeoServer
Layer ‘Cartographic line’
Symbology with cartographic line symbol.
Layer ‘Cartographic line’ rendered in ArcGIS
Layer ‘Cartographic line’ rendered in MapServer
Layer ‘Cartographic line’ rendered in GeoServer
Layer ‘Hash line’
Symbology with hash line symbol.
Layer ‘Hash line’ rendered in ArcGIS

Layer ‘Hash line’ rendered in MapServer
Layer ‘Hash line’ rendered in GeoServer
Picture Symbol
Symbology containing picture symbols.
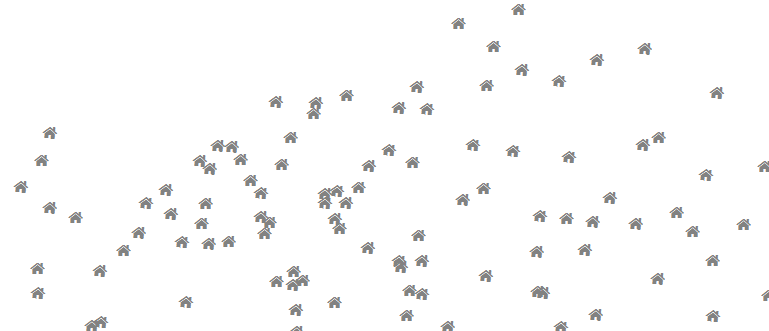
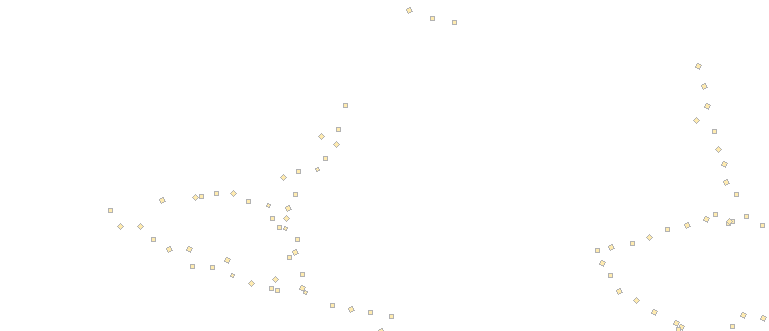
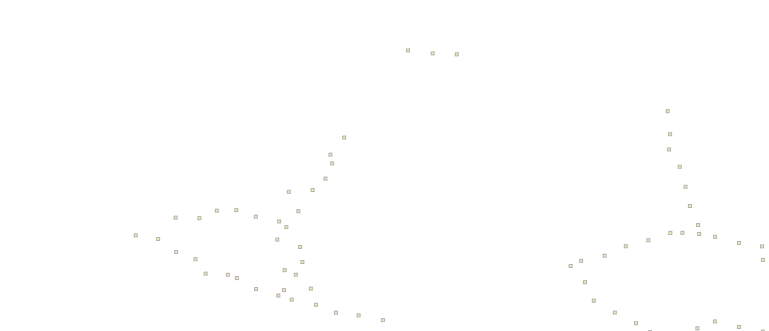
Layer ‘Cities’
Point layer with picture marker symbol.
Layer ‘Cities’ rendered in ArcGIS
Layer ‘Cities’ rendered in MapServer
Layer ‘Cities’ rendered in GeoServer
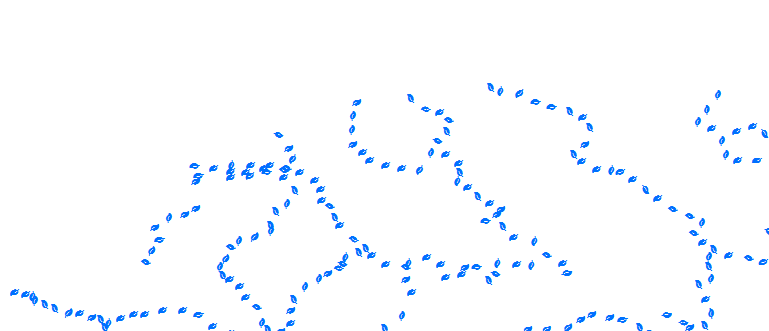
Layer ‘Rivers’
Line layer with picture line symbol.
Layer ‘Rivers’ rendered in ArcGIS

Layer ‘Rivers’ rendered in MapServer
Layer ‘Rivers’ rendered in GeoServer
Layer ‘Countries’
Polygon layer with picture fill symbol.
Layer ‘Countries’ rendered in ArcGIS
Layer ‘Countries’ rendered in MapServer
Layer ‘Countries’ rendered in GeoServer
Quantities Graduated
Symbology with graduated colors, no normalization.
Layer ‘Cities’
Point layer with graduated color symbology.
Layer ‘Cities’ rendered in ArcGIS
Layer ‘Cities’ rendered in MapServer
Layer ‘Cities’ rendered in GeoServer
Layer ‘Rivers’
Line layer with graduated color symbology.
Layer ‘Rivers’ rendered in ArcGIS
Layer ‘Rivers’ rendered in MapServer
Layer ‘Rivers’ rendered in GeoServer
Layer ‘Countries’
Polygon layer with graduated color symbology.
Layer ‘Countries’ rendered in ArcGIS
Layer ‘Countries’ rendered in MapServer
Layer ‘Countries’ rendered in GeoServer
Quantities Graduated Normalized
Symbology with graduated colors normalized.
Layer ‘Cities’
Point layer with graduated color symbology normalized.
Layer ‘Cities’ rendered in ArcGIS
Layer ‘Cities’ rendered in MapServer
Layer ‘Cities’ rendered in GeoServer
Layer ‘Rivers’
Line layer with graduated color symbology normalized.
Layer ‘Rivers’ rendered in ArcGIS
Layer ‘Rivers’ rendered in MapServer
Layer ‘Rivers’ rendered in GeoServer
Layer ‘Countries’
Polygon layer with graduated color symbology normalized.
Layer ‘Countries’ rendered in ArcGIS

Layer ‘Countries’ rendered in MapServer
Layer ‘Countries’ rendered in GeoServer
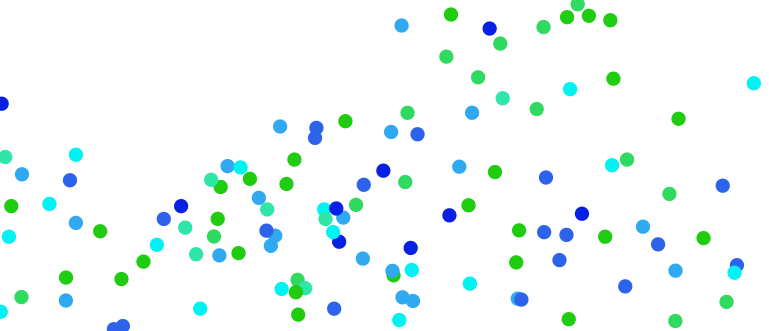
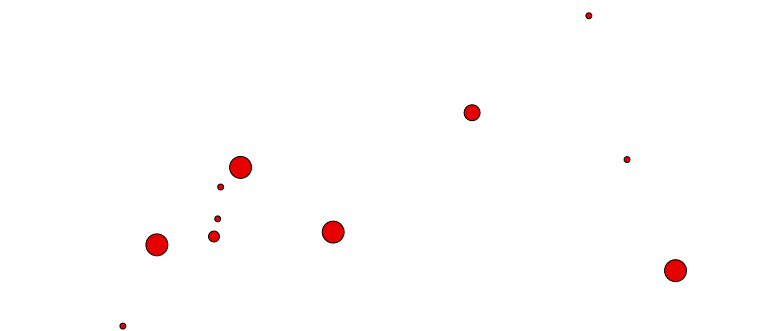
Quantities Graduated Symbols
Symbology with graduated size symbols. Features are divided in classes, each class has its own symbol size.
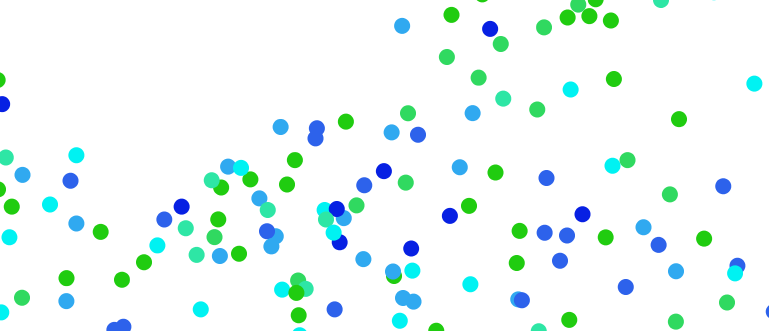
Layer ‘Cities’
Point layer with graduated size symbols normalized.
Layer ‘Cities’ rendered in ArcGIS
Layer ‘Cities’ rendered in MapServer
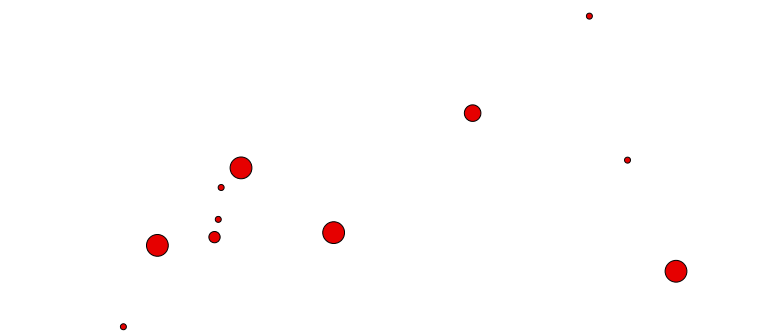
Layer ‘Cities’ rendered in GeoServer
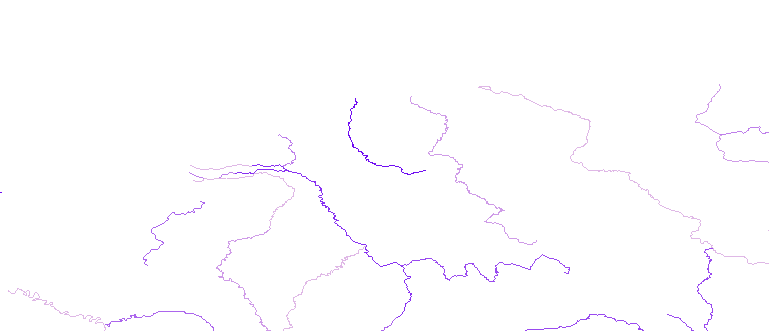
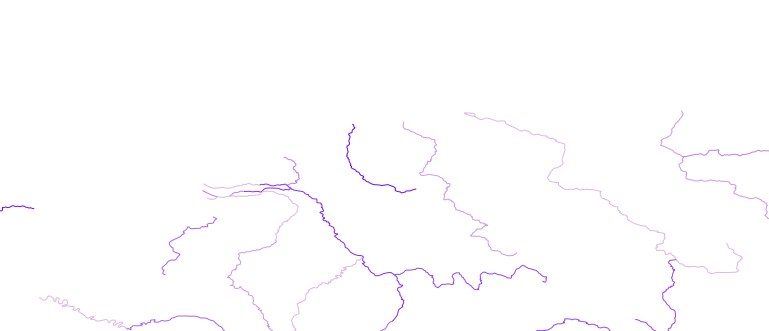
Layer ‘Rivers’
Line layer with graduated size symbol, not normalized.
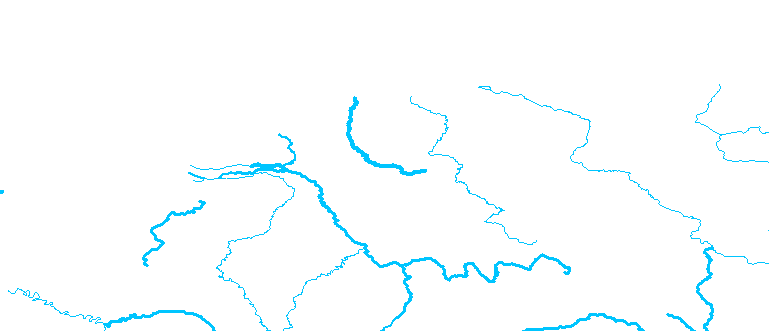
Layer ‘Rivers’ rendered in ArcGIS
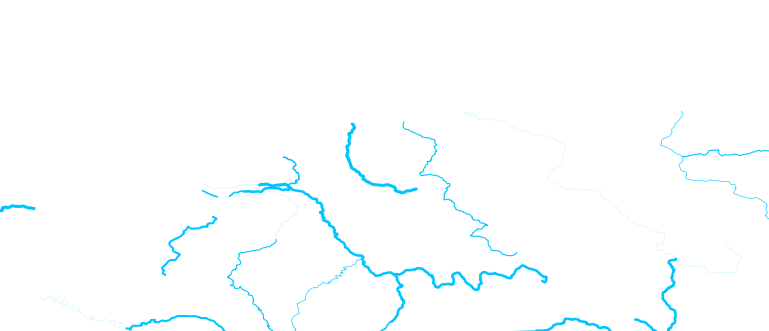
Layer ‘Rivers’ rendered in MapServer
Layer ‘Rivers’ rendered in GeoServer
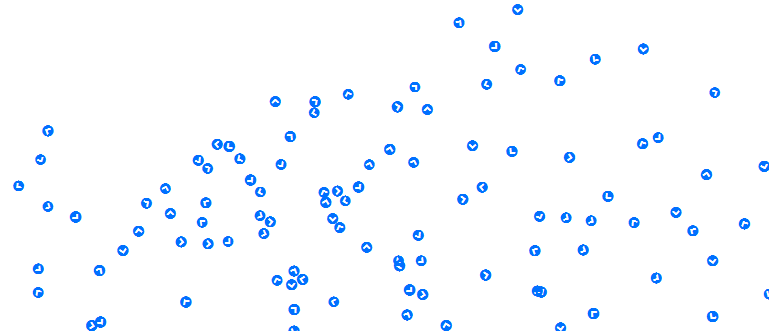
Rotation Symbol
Symbology with rotated symbols. ArcGIS knows two types of symbology GeoGraphic and Arithmic.
Geographic rotates labels from north in a clockwise direction, while Arithmetic rotates labels from east in a counterclockwise direction.
Layer ‘Geographic rotation’
Point layer with point symbols rotated geographically.
Layer ‘Geographic rotation’ rendered in ArcGIS
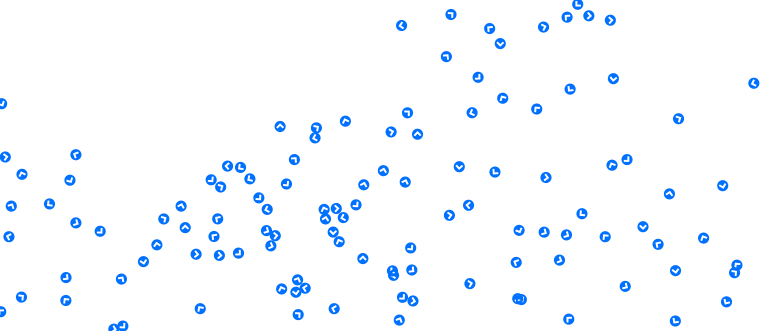
Layer ‘Geographic rotation’ rendered in MapServer
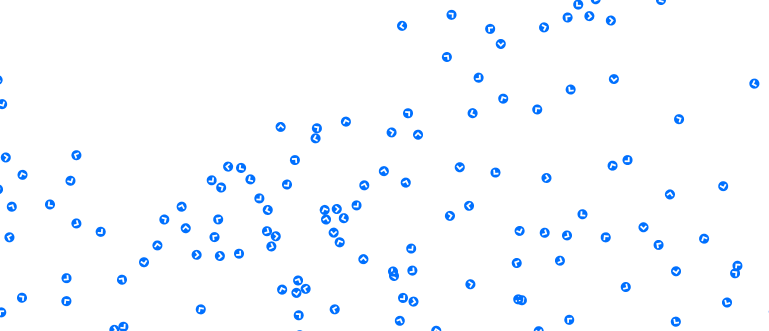
Layer ‘Geographic rotation’ rendered in GeoServer
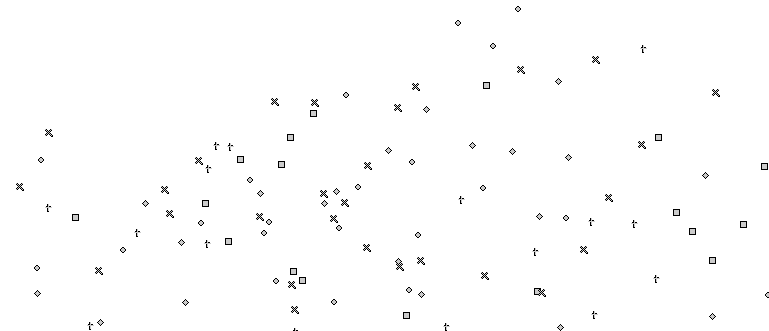
Layer ‘Arithmic rotation’
Point layer with point symbols rotated arithmically
Layer ‘Arithmic rotation’ rendered in ArcGIS
Layer ‘Arithmic rotation’ rendered in MapServer
Layer ‘Arithmic rotation’ rendered in GeoServer
Simple Marker Symbol
Symbology with simple marker symbols. Simple marker symbols are a fast-drawing set of basic glyph patterns with optional mask.
Layer ‘Cities’
Point layer with a simple marker symbol.
Layer ‘Cities’ rendered in ArcGIS
Layer ‘Cities’ rendered in MapServer
Layer ‘Cities’ rendered in GeoServer
Layer ‘Rivers’
Line layer with a simple marker line symbol.
Layer ‘Rivers’ rendered in ArcGIS
Layer ‘Rivers’ rendered in MapServer
Layer ‘Rivers’ rendered in GeoServer
Layer ‘Countries’
Polygon layer with a simple marker fill symbol.
Layer ‘Countries’ rendered in ArcGIS
Layer ‘Countries’ rendered in MapServer
Layer ‘Countries’ rendered in GeoServer
Stacked Symbol
Symbology composed from different layers of symbols.
Layer ‘Rivers’
Stacked line symbol.
Layer ‘Rivers’ rendered in ArcGIS
Layer ‘Rivers’ rendered in MapServer
Layer ‘Rivers’ rendered in GeoServer
Layer ‘Cities’
Stacked point symbol.
Layer ‘Cities’ rendered in ArcGIS
Layer ‘Cities’ rendered in MapServer
Layer ‘Cities’ rendered in GeoServer
Layer ‘Countries’
Stacked fill symbol.
Layer ‘Countries’ rendered in ArcGIS
Layer ‘Countries’ rendered in MapServer
Layer ‘Countries’ rendered in GeoServer
Unique Value
Symbology with a unique value classifiier.
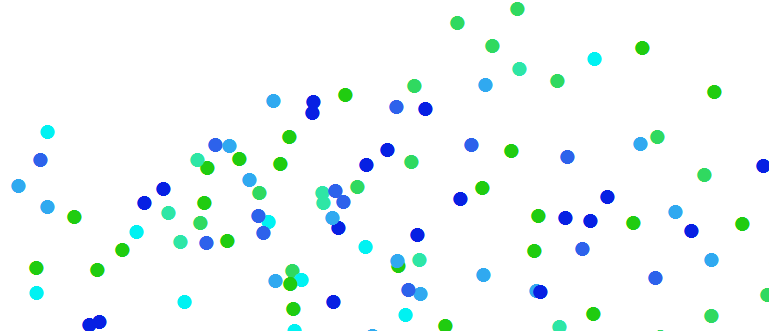
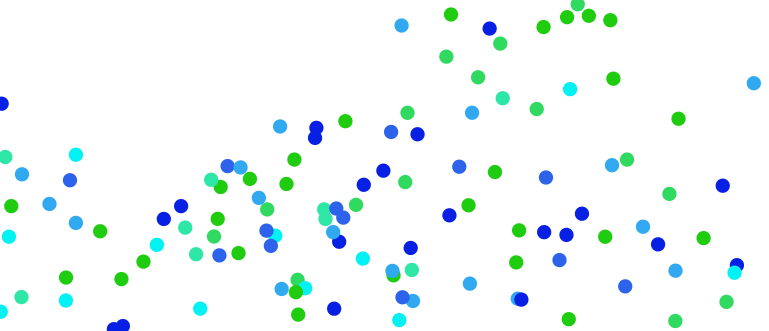
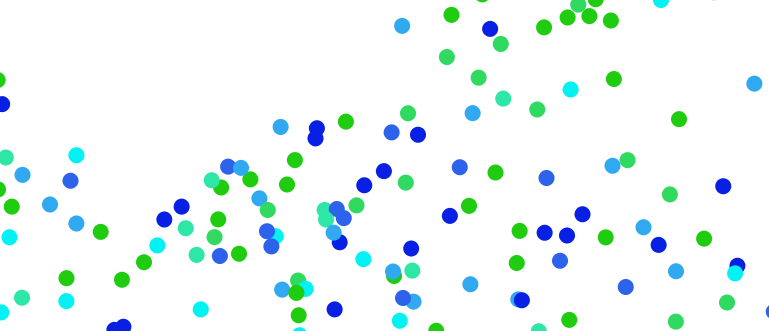
Layer ‘Cities’
Point layer with a unique value classifiier.
Layer ‘Cities’ rendered in ArcGIS
Layer ‘Cities’ rendered in MapServer
Layer ‘Cities’ rendered in GeoServer
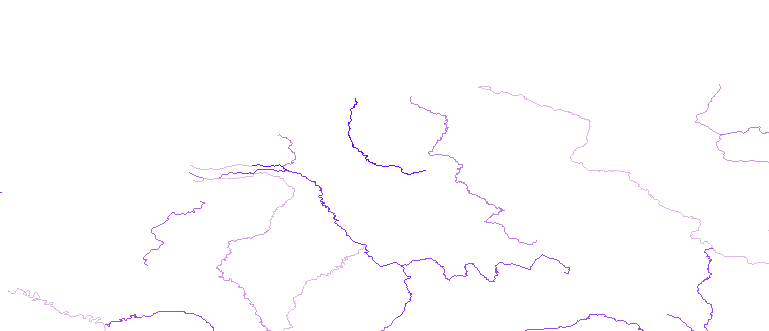
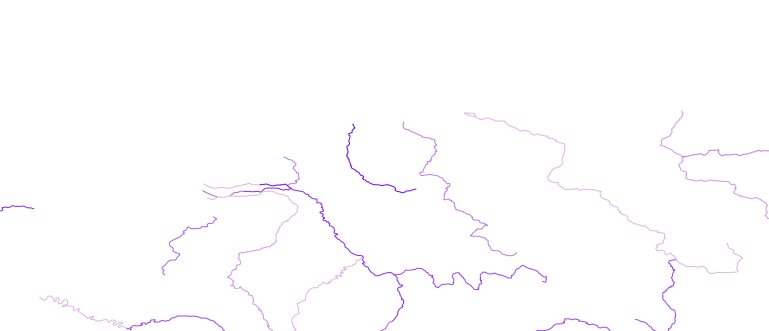
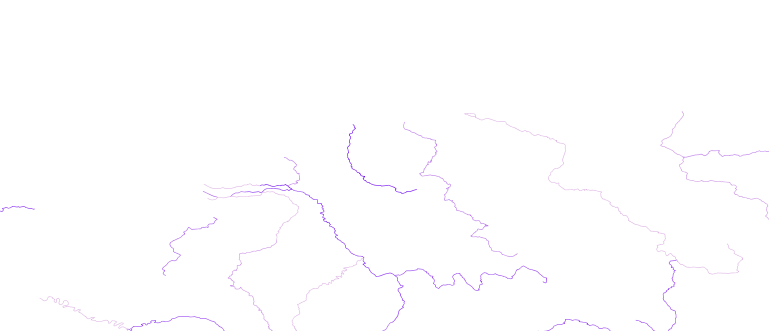
Layer ‘Rivers’
Line layer with a unique value classifiier.
Layer ‘Rivers’ rendered in ArcGIS
Layer ‘Rivers’ rendered in MapServer
Layer ‘Rivers’ rendered in GeoServer
Layer ‘Countries’
Polygon layer with a unique value classifiier.
Layer ‘Countries’ rendered in ArcGIS
Layer ‘Countries’ rendered in MapServer
Layer ‘Countries’ rendered in GeoServer
Unique Value Many Fields
Symbology with a unique multivalue classifiier.
Layer ‘Cities’
Point layer with a unique multivalue classifiier.
Layer ‘Cities’ rendered in ArcGIS
Layer ‘Cities’ rendered in MapServer
Layer ‘Cities’ rendered in GeoServer
Layer ‘Rivers’
Line layer with a unique multivalue classifiier.
Layer ‘Rivers’ rendered in ArcGIS
Layer ‘Rivers’ rendered in MapServer
Layer ‘Rivers’ rendered in GeoServer
Layer ‘Countries’
Polygon layer with a unique multivalue classifiier.
Layer ‘Countries’ rendered in ArcGIS
Layer ‘Countries’ rendered in MapServer
Layer ‘Countries’ rendered in GeoServer